
Page 26 - Read Online
P. 26
Kapaki et al. Neuroimmunol Neuroinflammation 2020;7:319-29 I http://dx.doi.org/10.20517/2347-8659.2019.26 Page 321
Table 1. Normal (cut-off) values of our laboratory [9]
CSF biomarker Normal value
total tau protein (τ T ) < 376 pg/mL
tau phosphorylated at threonine-181 (τ P-181 ) < 57 pg/mL
amyloid-β peptide with 42 amino acids (Aβ 42 ) > 682 pg/mL
> 0.09
Aβ 42 /Aβ 40
CSF: cerebrospinal fluid
[7]
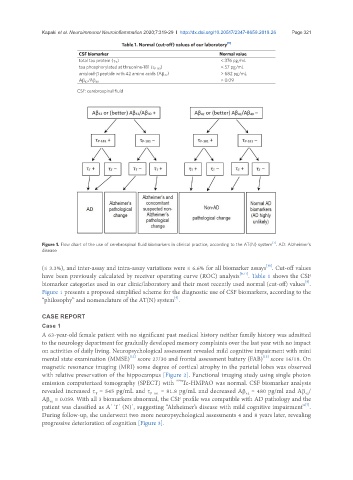
Figure 1. Flow chart of the use of cerebrospinal fluid biomarkers in clinical practice, according to the AT(N) system . AD: Alzheimer’s
disease
(≤ 3.3%), and inter-assay and intra-assay variations were ≤ 6.6% for all biomarker assays . Cut-off values
[10]
have been previously calculated by receiver operating curve (ROC) analysis [9,11] . Table 1 shows the CSF
[9]
biomarker categories used in our clinic/laboratory and their most recently used normal (cut-off) values .
Figure 1 presents a proposed simplified scheme for the diagnostic use of CSF biomarkers, according to the
“philosophy” and nomenclature of the AT(N) system .
[7]
CASE REPORT
Case 1
A 63-year-old female patient with no significant past medical history neither family history was admitted
to the neurology department for gradually developed memory complaints over the last year with no impact
on activities of daily living. Neuropsychological assessment revealed mild cognitive impairment with mini
mental state examination (MMSE) score 27/30 and frontal assessment battery (FAB) score 16/18. On
[13]
[12]
magnetic resonance imaging (MRI) some degree of cortical atrophy in the parietal lobes was observed
with relative preservation of the hippocampus [Figure 2]. Functional imaging study using single photon
99m
emission computerized tomography (SPECT) with Tc-HMPAO was normal. CSF biomarker analysis
revealed increased τ = 545 pg/mL and τ P-181 = 81.8 pg/mL and decreased Aβ = 480 pg/ml and Aβ /
42
42
T
Aβ = 0.059. With all 3 biomarkers abnormal, the CSF profile was compatible with AD pathology and the
40
[7]
patient was classified as A T (N) , suggesting “Alzheimer’s disease with mild cognitive impairment” .
+
+
+
During follow-up, she underwent two more neuropsychological assessments 4 and 8 years later, revealing
progressive deterioration of cognition [Figure 3].