
Page 105 - Read Online
P. 105
Muroy et al. Neuroimmunol Neuroinflammation 2020;7:166-82 I http://dx.doi.org/10.20517/2347-8659.2020.16 Page 173
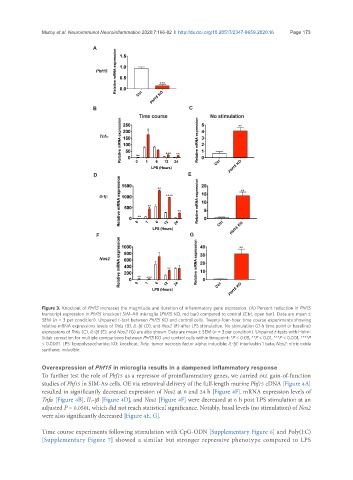
Figure 3. Knockout of Phf15 increases the magnitude and duration of inflammatory gene expression. (A) Percent reduction in Phf15
transcript expression in Phf15 knockout SIM-A9 microglia (Phf15 KO, red bar) compared to control (Ctrl, open bar). Data are mean ±
SEM (n = 3 per condition). Unpaired t-test between Phf15 KO and control cells. Twenty-four-hour time course experiments showing
relative mRNA expressions levels of Tnfα (B), IL-1β (D), and Nos2 (F) after LPS stimulation. No stimulation (0-h time point or baseline)
expressions of Tnfα (C), IL-1β (E), and Nos2 (G) are also shown. Data are mean ± SEM (n = 3 per condition). Unpaired t-tests with Holm-
Sidak correction for multiple comparisons between Phf15 KO and control cells within timepoint: *P < 0.05, **P < 0.01, ***P < 0.001, ****P
< 0.0001. LPS: lipopolysaccharide; KO: knockout; Tnfα: tumor necrosis factor alpha; inducible; IL-1β: interleukin 1 beta; Nos2: nitric oxide
synthase, inducible
Overexpression of Phf15 in microglia results in a dampened inflammatory response
To further test the role of Phf15 as a repressor of proinflammatory genes, we carried out gain-of-function
studies of Phf15 in SIM-A9 cells. OE via retroviral delivery of the full-length murine Phf15 cDNA [Figure 4A]
resulted in significantly decreased expression of Nos2 at 0 and 24 h [Figure 4F]. mRNA expression levels of
Tnf α [Figure 4B], IL-1 β [Figure 4D], and Nos2 [Figure 4F] were decreased at 6 h post LPS stimulation at an
adjusted P = 0.0501, which did not reach statistical significance. Notably, basal levels (no stimulation) of Nos2
were also significantly decreased [Figure 4E, G].
Time course experiments following stimulation with CpG-ODN [Supplementary Figure 6] and Poly(I:C)
[Supplementary Figure 7] showed a similar but stronger repressive phenotype compared to LPS