
Page 106 - Read Online
P. 106
Page 174 Muroy et al. Neuroimmunol Neuroinflammation 2020;7:166-82 I http://dx.doi.org/10.20517/2347-8659.2020.16
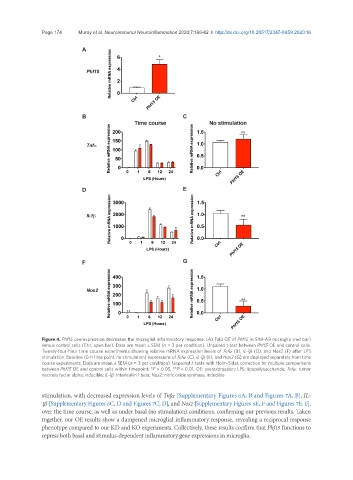
Figure 4. Phf15 overexpression decreases the microglial inflammatory response. (A) Fold OE of Phf15 in SIM-A9 microglia (red bar)
versus control cells (Ctrl, open bar). Data are mean ± SEM (n = 3 per condition). Unpaired t-test between Phf15 OE and control cells.
Twenty-four-hour time course experiments showing relative mRNA expression levels of Tnfα (B), IL-1β (D), and Nos2 (F) after LPS
stimulation. Baseline (0-h time point, no stimulation) expressions of Tnfα (C), IL-1β (E), and Nos2 (G) are displayed separately from time
course experiments. Data are mean ± SEM (n = 3 per condition). Unpaired t-tests with Holm-Sidak correction for multiple comparisons
between Phf15 OE and control cells within timepoint: *P < 0.05, **P < 0.01. OE: overexpression; LPS: lipopolysaccharide; Tnfα: tumor
necrosis factor alpha; inducible; IL-1β: interleukin 1 beta; Nos2: nitric oxide synthase, inducible
stimulation, with decreased expression levels of Tnf α [Supplementary Figures 6A, B and Figures 7A, B], IL-
1 β [Supplementary Figures 6C, D and Figures 7C, D], and Nos2 [Supplementary Figures 6E, F and Figures 7E, F],
over the time course, as well as under basal (no stimulation) conditions, confirming our previous results. Taken
together, our OE results show a dampened microglial inflammatory response, revealing a reciprocal response
phenotype compared to our KD and KO experiments. Collectively, these results confirm that Phf15 functions to
repress both basal and stimulus-dependent inflammatory gene expressions in microglia.