
Page 104 - Read Online
P. 104
Page 172 Muroy et al. Neuroimmunol Neuroinflammation 2020;7:166-82 I http://dx.doi.org/10.20517/2347-8659.2020.16
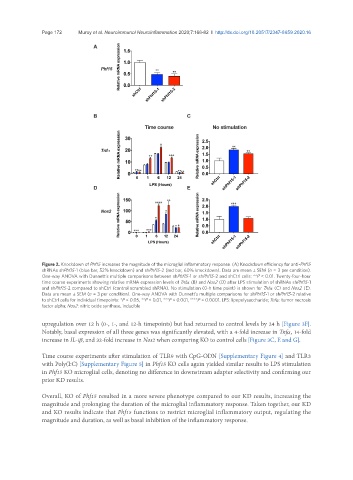
Figure 2. Knockdown of Phf15 increases the magnitude of the microglial inflammatory response. (A) Knockdown efficiency for anti-Phf15
shRNAs shPhf15-1 (blue bar, 52% knockdown) and shPhf15-2 (red bar, 60% knockdown). Data are mean ± SEM (n = 3 per condition).
One-way ANOVA with Dunnett’s multiple comparisons between shPhf15-1 or shPhf15-2 and shCtrl cells: **P < 0.01. Twenty-four-hour
time course experiments showing relative mRNA expression levels of Tnfα (B) and Nos2 (D) after LPS stimulation of shRNAs shPhf15-1
and shPhf15-2 compared to shCtrl (control scrambled shRNA). No stimulation (0-h time point) is shown for Tnfα (C) and Nos2 (E).
Data are mean ± SEM (n = 3 per condition). One-way ANOVA with Dunnett’s multiple comparisons for shPhf15-1 or shPhf15-2 relative
to shCtrl cells for individual timepoints: *P < 0.05, **P < 0.01, ***P < 0.001, ****P < 0.0001. LPS: lipopolysaccharide; Tnfα: tumor necrosis
factor alpha; Nos2: nitric oxide synthase, inducible
upregulation over 12 h (0-, 1-, and 12-h timepoints) but had returned to control levels by 24 h [Figure 3F].
Notably, basal expression of all three genes was significantly elevated, with a 4-fold increase in Tnf α, 14-fold
increase in IL-1 β, and 32-fold increase in Nos2 when comparing KO to control cells [Figure 3C, E and G].
Time course experiments after stimulation of TLR9 with CpG-ODN [Supplementary Figure 4] and TLR3
with Poly(I:C) [Supplementary Figure 5] in Phf15 KO cells again yielded similar results to LPS stimulation
in Phf15 KO microglial cells, denoting no difference in downstream adapter selectivity and confirming our
prior KD results.
Overall, KO of Phf15 resulted in a more severe phenotype compared to our KD results, increasing the
magnitude and prolonging the duration of the microglial inflammatory response. Taken together, our KD
and KO results indicate that Phf15 functions to restrict microglial inflammatory output, regulating the
magnitude and duration, as well as basal inhibition of the inflammatory response.