
Page 108 - Read Online
P. 108
Page 176 Muroy et al. Neuroimmunol Neuroinflammation 2020;7:166-82 I http://dx.doi.org/10.20517/2347-8659.2020.16
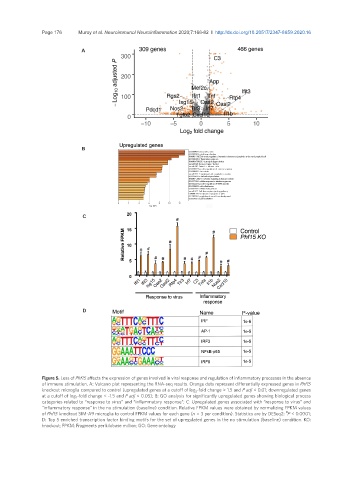
Figure 5. Loss of Phf15 affects the expression of genes involved in viral response and regulation of inflammatory processes in the absence
of immune stimulation. A: Volcano plot representing the RNA-seq results. Orange dots represent differentially expressed genes in Phf15
knockout microglia compared to control (upregulated genes at a cutoff of log 2 -fold change > 1.5 and P adj < 0.01; downregulated genes
at a cutoff of log 2 -fold change < -1.5 and P adj < 0.05); B: GO analysis for significantly upregulated genes showing biological process
categories related to “response to virus” and “inflammatory response”; C: Upregulated genes associated with “response to virus” and
“inflammatory response” in the no stimulation (baseline) condition. Relative FPKM values were obtained by normalizing FPKM values
#
of Phf15 knockout SIM-A9 microglia to control FPKM values for each gene (n = 3 per condition). Statistics are by DESeq2: P < 0.0001;
D: Top 5 enriched transcription factor binding motifs for the set of upregulated genes in the no stimulation (baseline) condition. KO:
knockout; FPKM: Fragments per kilobase million; GO: Gene ontology