
Page 62 - Read Online
P. 62
Page 58 Griffiths et al. Neuroimmunol Neuroinflammation 2020;7:51-67 I http://dx.doi.org/10.20517/2347-8659.2019.21
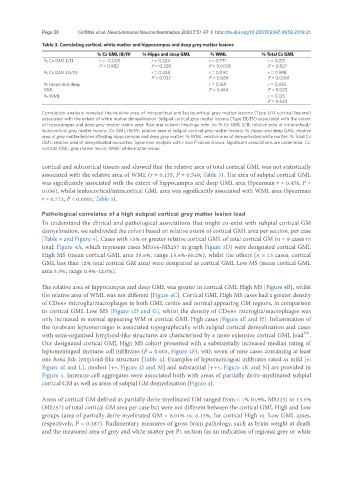
Table 3. Correlating cortical, white matter and hippocampus and deep grey matter lesions
% Cx GML III/IV % Hippo and deep GML % WML % Total Cx GML
% Cx GML I/II r = -0.005 r = 0.224 r = 0.771 r = 0.051
P = 0.982 P = 0.328 P < 0.0001 P = 0.827
% Cx GML III/IV r = 0.458 r = 0.092 r = 0.988
P = 0.037 P = 0.684 P < 0.0001
% Hippo and deep r = 0.169 r = 0.495
GML P = 0.464 P = 0.023
% WML r = 0.135
P = 0.549
Correlation analysis revealed the relative area of intracortical and leukocortical grey matter lesions (Type I/II cortical lesions)
associated with the extent of white matter demyelination. Subpial cortical grey matter lesions (Type III/IV) associated with the extent
of hippocampus and deep grey matter lesion area. Row and column headings refer to: % Cx GML I/II: relative area of intracortical/
leukocortical grey matter lesions; Cx GML III/IV: relative area of subpial cortical grey matter lesions; % Hippo and deep GML: relative
area of grey matter lesions affecting hippocampus and deep grey matter; % WML: relative area of demyelinated white matter; % Total Cx
GML: relative area of demyelinated neocortex. Spearman analysis with r and P values shown. Significant associations are underlined. Cx:
cortical; GML: grey matter lesion; WML: white matter lesion
cortical and subcortical tissues and showed that the relative area of total cortical GML was not statistically
associated with the relative area of WML (r = 0.135, P = 0.549; Table 3). The area of subpial cortical GML
was significantly associated with the extent of hippocampus and deep GML area (Spearman r = 0.458, P =
0.036), whilst leukocortical/intracortical GML area was significantly associated with WML area (Spearman
r = 0.771, P < 0.0001; Table 3).
Pathological correlates of a high subpial cortical grey matter lesion load
To understand the clinical and pathological associations that might co-exist with subpial cortical GM
demyelination, we subdivided the cohort based on relative extent of cortical GML area per section, per case
[Table 4 and Figure 4]. Cases with 15% or greater relative cortical GML of total cortical GM (n = 9 cases in
total; Figure 4A, which represent cases MS366-MS257 in graph Figure 3D) were designated cortical GML
High MS (mean cortical GML area 35.6%; range 15.6%-60.2%), whilst the others (n = 13 cases, cortical
GML less than 12% total cortical GM area) were designated as cortical GML Low MS (mean cortical GML
area 5.5%; range 0.9%-12.0%).
The relative area of hippocampus and deep GML was greater in cortical GML High MS [Figure 4B], whilst
the relative area of WML was not different [Figure 4C]. Cortical GML High MS cases had a greater density
of CD68+ microglia/macrophages in both GML centre and normal appearing GM regions, in comparison
to cortical GML Low MS [Figure 4D and G], whilst the density of CD68+ microglia/macrophages was
only increased in normal appearing WM of cortical GML High cases [Figure 4E and H]. Inflammation of
the forebrain leptomeninges is associated topographically with subpial cortical demyelination and cases
with semi-organised lymphoid-like structures are characterised by a more extensive cortical GML load .
[13]
Our designated cortical GML High MS cohort presented with a substantially increased median rating of
leptomeningeal immune cell infiltrates (P = 0.003, Figure 4F), with seven of nine cases containing at least
one bona fide lymphoid-like structure [Table 4]. Examples of leptomeningeal infiltrates rated as mild [+;
Figure 4I and L], modest [++, Figure 4J and M] and substantial [+++, Figure 4K and N] are provided in
Figure 4. Immune cell aggregates were associated both with areas of partially de/re-myelinated subpial
cortical GM as well as areas of subpial GM demyelination [Figure 4].
Areas of cortical GM defined as partially de/re-myelinated GM ranged from < 1% (0.9%, MS223) to 13.5%
(MS257) of total cortical GM area per case but were not different between the cortical GML High and Low
groups (area of partially de/re-myelinated GM = 8.01% vs. 6.13%, for cortical High vs. Low GML cases,
respectively, P = 0.387). Rudimentary measures of gross brain pathology, such as brain weight at death
and the measured area of grey and white matter per P1 section (as an indication of regional grey or white