
Page 60 - Read Online
P. 60
Page 56 Griffiths et al. Neuroimmunol Neuroinflammation 2020;7:51-67 I http://dx.doi.org/10.20517/2347-8659.2019.21
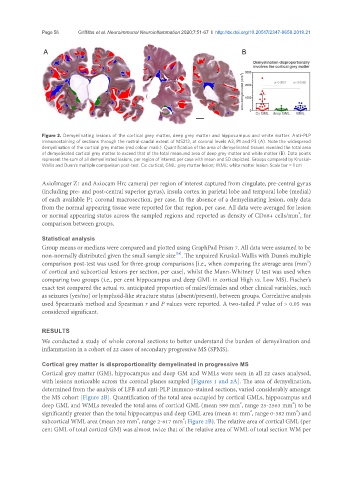
Figure 2. Demyelinating lesions of the cortical grey matter, deep grey matter and hippocampus and white matter. Anti-PLP
immunostaining of sections through the rostral-caudal extent of MS212, at coronal levels A3, P1 and P3 (A). Note the widespread
demyelination of the cortical grey matter (red colour mask). Quantification of the area of demyelinated tissues revealed the total area
of demyelinated cortical grey matter to exceed that of the total measured area of deep grey matter and white matter (B). Data points
represent the sum of all demyelinated lesions, per region of interest per case with mean and SD depicted. Groups compared by Kruskal-
Wallis and Dunn’s multiple comparison post-test. Cx: cortical; GML: grey matter lesion; WML: white matter lesion. Scale bar = 1 cm
AxioImager Z1 and Axiocam Hrc camera) per region of interest captured from cingulate, pre-central gyrus
(including pre- and post-central superior gyrus), insula cortex in parietal lobe and temporal lobe (medial)
of each available P1 coronal macrosection, per case. In the absence of a demyelinating lesion, only data
from the normal appearing tissue were reported for that region, per case. All data were averaged for lesion
2
or normal appearing status across the sampled regions and reported as density of CD68+ cells/mm , for
comparison between groups.
Statistical analysis
Group means or medians were compared and plotted using GraphPad Prism 7. All data were assumed to be
[24]
non-normally distributed given the small sample size . The unpaired Kruskal-Wallis with Dunn’s multiple
2
comparison post-test was used for three-group comparisons [i.e., when comparing the average area (mm )
of cortical and subcortical lesions per section, per case], whilst the Mann-Whitney U test was used when
comparing two groups (i.e., per cent hippocampus and deep GML in cortical High vs. Low MS). Fischer’s
exact test compared the actual vs. anticipated proportion of males/females and other clinical variables, such
as seizures (yes/no) or lymphoid-like structure status (absent/present), between groups. Correlative analysis
used Spearman’s method and Spearman r and P values were reported. A two-tailed P value of > 0.05 was
considered significant.
RESULTS
We conducted a study of whole coronal sections to better understand the burden of demyelination and
inflammation in a cohort of 22 cases of secondary progressive MS (SPMS).
Cortical grey matter is disproportionality demyelinated in progressive MS
Cortical grey matter (GM), hippocampus and deep GM and WMLs were seen in all 22 cases analysed,
with lesions noticeable across the coronal planes sampled [Figures 1 and 2A]. The area of demyelination,
determined from the analysis of LFB and anti-PLP immuno-stained sections, varied considerably amongst
the MS cohort [Figure 2B]. Quantification of the total area occupied by cortical GMLs, hippocampus and
2
2
deep GML and WMLs revealed the total area of cortical GML (mean 589 mm , range 25-2563 mm ) to be
2
2
significantly greater than the total hippocampus and deep GML area (mean 81 mm , range 0-382 mm ) and
2
2
subcortical WML area (mean 203 mm , range 2-617 mm ; Figure 2B). The relative area of cortical GML (per
cent GML of total cortical GM) was almost twice that of the relative area of WML of total section WM per