
Page 234 - Read Online
P. 234
Chaurasia et al. Quadrigeminal plate lipoma
A B C D
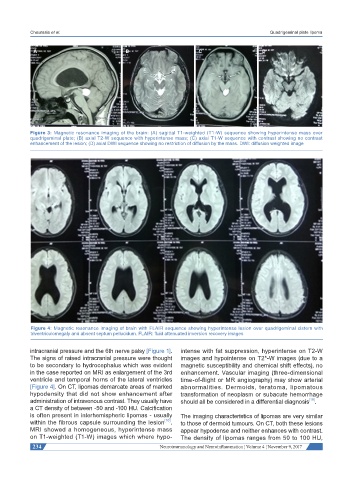
Figure 3: Magnetic resonance imaging of the brain: (A) sagittal T1-weighted (T1-W) sequence showing hyperintense mass over
quadrigeminal plate; (B) axial T2-W sequence with hyperintense mass; (C) axial T1-W sequence with contrast showing no contrast
enhancement of the lesion; (D) axial DWI sequence showing no restriction of diffusion by the mass. DWI: diffusion weighted image
Figure 4: Magnetic resonance imaging of brain with FLAIR sequence showing hyperintense lesion over quadrigeminal cistern with
triventriculomegaly and absent septum pellucidum. FLAIR: fluid attenuated inversion recovery images
intracranial pressure and the 6th nerve palsy [Figure 1]. intense with fat suppression, hyperintense on T2-W
The signs of raised intracranial pressure were thought images and hypointense on T2*-W images (due to a
to be secondary to hydrocephalus which was evident magnetic susceptibility and chemical shift effects), no
in the case reported on MRI as enlargement of the 3rd enhancement. Vascular imaging (three-dimensional
ventricle and temporal horns of the lateral ventricles time-of-flight or MR angiography) may show arterial
[Figure 4]. On CT, lipomas demarcate areas of marked abnormalities. Dermoids, teratoma, lipomatous
hypodensity that did not show enhancement after transformation of neoplasm or subacute hemorrhage
administration of intravenous contrast. They usually have should all be considered in a differential diagnosis .
[10]
a CT density of between -50 and -100 HU. Calcification
is often present in interhemispheric lipomas - usually The imaging characteristics of lipomas are very similar
within the fibrous capsule surrounding the lesion [10] . to those of dermoid tumours. On CT, both these lesions
MRI showed a homogeneous, hyperintense mass appear hypodense and neither enhances with contrast.
on T1-weighted (T1-W) images which where hypo- The density of lipomas ranges from 50 to 100 HU,
234 Neuroimmunology and Neuroinflammation ¦ Volume 4 ¦ November 9, 2017