
Page 274 - Read Online
P. 274
Liu et al. Low antioxidant status of patients with CNSI
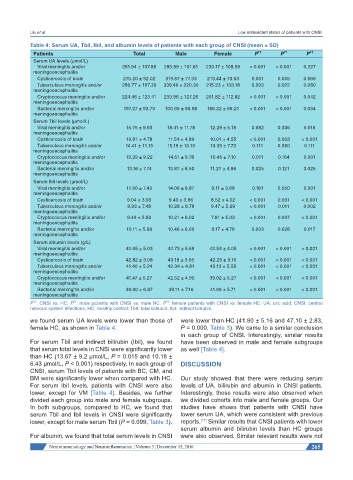
Table 4: Serum UA, Tbil, Ibil, and albumin levels of patients with each group of CNSI (mean ± SD)
Patients Total Male Female P 1† P 2† P 3†
Serum UA levels (μmol/L)
Viral meningitis and/or 261.94 ± 107.88 285.89 ± 101.81 230.17 ± 108.56 < 0.001 < 0.001 0.227
meningoencephalitis
Cysticercosis of brain 275.20 ± 92.02 319.87 ± 77.33 213.44 ± 73.63 0.001 0.005 0.066
Tuberculous meningitis and/or 286.77 ± 197.39 339.49 ± 220.30 215.23 ± 133.18 0.003 0.022 0.080
meningoencephalitis
Cryptococcus meningitis and/or 224.46 ± 123.41 233.96 ± 127.26 201.82 ± 112.82 < 0.001 < 0.001 0.042
meningoencephalitis
Bacterial meningitis and/or 197.27 ± 93.73 100.95 ± 96.98 186.22 ± 86.21 < 0.001 < 0.001 0.034
meningoencephalitis
Serum Tbil levels (μmol/L)
Viral meningitis and/or 15.75 ± 9.93 18.41 ± 11.78 12.29 ± 5.18 0.682 0.336 0.018
meningoencephalitis
Cysticercosis of brain 10.91 ± 4.78 11.54 ± 4.89 10.01 ± 4.55 < 0.001 0.003 < 0.001
Tuberculous meningitis and/or 14.41 ± 11.15 15.19 ± 13.13 13.35 ± 7.73 0.111 0.350 0.111
meningoencephalitis
Cryptococcus meningitis and/or 13.29 ± 9.22 14.51 ± 9.78 10.45 ± 7.10 0.011 0.164 0.001
meningoencephalitis
Bacterial meningitis and/or 13.16 ± 7.74 13.87 ± 8.50 11.27 ± 4.96 0.025 0.121 0.025
meningoencephalitis
Serum Ibil levels (μmol/L)
Viral meningitis and/or 11.90 ± 7.43 14.06 ± 8.87 9.11 ± 3.68 0.181 0.550 0.001
meningoencephalitis
Cysticercosis of brain 9.04 ± 3.93 9.40 ± 3.86 8.52 ± 4.02 < 0.001 0.001 < 0.001
Tuberculous meningitis and/or 9.93 ± 7.48 10.28 ± 8.78 9.47 ± 5.29 < 0.001 0.011 0.002
meningoencephalitis
Cryptococcus meningitis and/or 9.49 ± 5.82 10.21 ± 6.02 7.81 ± 5.03 < 0.001 0.007 < 0.001
meningoencephalitis
Bacterial meningitis and/or 10.11 ± 5.68 10.46 ± 6.00 9.17 ± 4.79 0.003 0.028 0.017
meningoencephalitis
Serum albumin levels (g/L)
Viral meningitis and/or 42.65 ± 5.03 42.73 ± 5.69 42.54 ± 4.05 < 0.001 < 0.001 < 0.001
meningoencephalitis
Cysticercosis of brain 42.82 ± 3.08 43.18 ± 3.05 42.29 ± 3.10 < 0.001 < 0.001 < 0.001
Tuberculous meningitis and/or 41.40 ± 5.24 42.34 ± 4.81 40.13 ± 5.58 < 0.001 < 0.001 < 0.001
meningoencephalitis
Cryptococcus meningitis and/or 41.47 ± 5.27 42.52 ± 4.95 39.02 ± 5.27 < 0.001 < 0.001 < 0.001
meningoencephalitis
Bacterial meningitis and/or 39.90 ± 6.87 39.11 ± 7.16 41.99 ± 5.71 < 0.001 < 0.001 < 0.001
meningoencephalitis
3†
P : CNSI vs. HC; P : male patients with CNSI vs. male HC; P : female patients with CNSI vs. female HC; UA: uric acid; CNSI: central
1†
2†
nervous system infections; HC: healthy control; Tbil: total bilirubin; Ibil: indirect bilirubin
we found serum UA levels were lower than those of were lower than HC (41.80 ± 5.16 and 47.10 ± 2.83,
female HC, as shown in Table 4. P = 0.000, Table 3). We came to a similar conclusion
in each group of CNSI. Interestingly, similar results
For serum Tbil and indirect bilirubin (Ibil), we found have been observed in male and female subgroups
that serum total levels in CNSI were significantly lower as well [Table 4].
than HC (13.67 ± 9.2 μmol/L, P = 0.015 and 10.18 ±
6.43 μmol/L, P < 0.001) respectively. In each group of DISCUSSION
CNSI, serum Tbil levels of patients with BC, CM, and
BM were significantly lower when compared with HC. Our study showed that there were reducing serum
For serum Ibil levels, patients with CNSI were also levels of UA, bilirubin and albumin in CNSI patients.
lower, except for VM [Table 4]. Besides, we further Interestingly, these results were also observed when
divided each group into male and female subgroups. we divided cohorts into male and female groups. Our
In both subgroups, compared to HC, we found that studies have shown that patients with CNSI have
serum Tbil and Ibil levels in CNSI were significantly lower serum UA, which were consistent with previous
lower, except for male serum Tbil (P = 0.099, Table 3). reports. Similar results that CNSI patients with lower
[17]
serum albumin and bilirubin levels than HC groups
For albumin, we found that total serum levels in CNSI were also observed. Similar relevant results were not
Neuroimmunology and Neuroinflammation ¦ Volume 3 ¦ December 15, 2016 265