
Page 273 - Read Online
P. 273
Liu et al. Low antioxidant status of patients with CNSI
Table 1: Demographic of patients with CNSI and healthy control
Patients No. of patients Male Female Ages (mean ± SD) P
Healthy control 114 71 43 37.76 ± 10.21
Viral meningitis and/or meningoencephalitis 107 60 47 35.15 ± 13.38 0.061
Cysticercosis of brain 85 50 35 35.67 ± 12.75 0.231
Tuberculous meningitis and/or 98 56 42 35.98 ± 15.58 0.369
meningoencephalitis
Cryptococcus meningitis and/or 89 62 27 37.81 ± 12.88 0.437
meningoencephalitis
Bacterial meningitis and/or 55 40 15 35.64 ± 19.43 0.377
meningoencephalitis
CNSI: central nervous system infections; P: ages of patients with CNSI vs. ages of healthy control
Table 2: Presenting clinical symptoms of CNSI (%)
Viral meningitis Tuberculous Cryptococcus Bacterial
Characteristics and/or Cysticercosis meningitis and/or meningitis and/or meningitis and/or
of brain
meningoencephalitis meningoencephalitis meningoencephalitis meningoencephalitis
Number 107 85 98 89 55
Headache 105 (98.1%) 46 (54.1%) 98 (100%) 89 (100%) 55 (100%)
Fever 103 (96.3%) 0 96 (97.9%) 79 (88.8%) 54 (98.2%)
Vomit 69 (64.5%) 12 (14.1%) 57 (58.2%) 71 (79.8%) 42 (76.4%)
Seizure 4 (3.7%) 53 (62.4%) 9 (9.18%) 6 (6.74%) 1 (1.82%)
CNSI: central nervous system infections
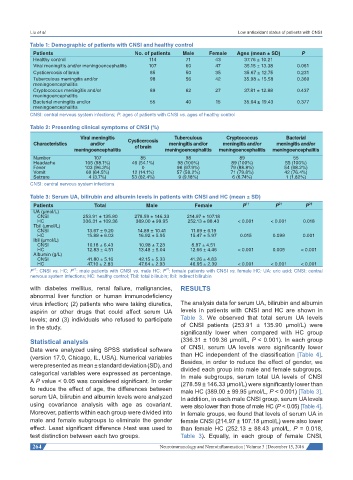
Table 3: Serum UA, bilirubin and albumin levels in patients with CNSI and HC (mean ± SD)
Patients Total Male Female P 1† P 2† P 3†
UA (μmol/L)
CNSI 253.91 ± 135.90 278.59 ± 146.33 214.97 ± 107.18
HC 336.31 ± 109.36 389.00 ± 99.95 252.13 ± 88.43 < 0.001 < 0.001 0.018
Tbil (μmol/L)
CNSI 13.67 ± 9.20 14.89 ± 10.41 11.69 ± 6.19
HC 15.88 ± 6.03 16.92 ± 5.95 15.47 ± 5.97 0.015 0.099 0.001
Ibil (μmol/L)
CNSI 10.18 ± 6.43 10.98 ± 7.23 8.87 ± 4.51
HC 12.83 ± 4.51 13.48 ± 5.04 12.66 ± 4.46 < 0.001 0.005 < 0.001
Albumin (g/L)
CNSI 41.80 ± 5.16 42.15 ± 5.33 41.26 ± 4.83
HC 47.10 ± 2.83 47.64 ± 2.93 46.95 ± 2.39 < 0.001 < 0.001 < 0.001
1†
2†
3†
P : CNSI vs. HC; P : male patients with CNSI vs. male HC; P : female patients with CNSI vs. female HC; UA: uric acid; CNSI: central
nervous system infections; HC: healthy control; Tbil: total bilirubin; Ibil: indirect bilirubin
with diabetes mellitus, renal failure, malignancies, RESULTS
abnormal liver function or human immunodeficiency
virus infection; (2) patients who were taking diuretics, The analysis data for serum UA, bilirubin and albumin
aspirin or other drugs that could affect serum UA levels in patients with CNSI and HC are shown in
levels; and (3) individuals who refused to participate Table 3. We observed that total serum UA levels
in the study. of CNSI patients (253.91 ± 135.90 μmol/L) were
significantly lower when compared with HC group
Statistical analysis (336.31 ± 109.36 μmol/L, P < 0.001). In each group
Data were analyzed using SPSS statistical software of CNSI, serum UA levels were significantly lower
(version 17.0, Chicago, IL, USA). Numerical variables than HC independent of the classification [Table 4].
were presented as mean ± standard deviation (SD), and Besides, in order to reduce the effect of gender, we
divided each group into male and female subgroups.
categorical variables were expressed as percentage. In male subgroups, serum total UA levels of CNSI
A P value < 0.05 was considered significant. In order (278.59 ± 146.33 μmol/L) were significantly lower than
to reduce the effect of age, the differences between male HC (389.00 ± 99.95 μmol/L, P < 0.001) [Table 3].
serum UA, bilirubin and albumin levels were analyzed In addition, in each male CNSI group, serum UA levels
using covariance analysis with age as covariant. were also lower than those of male HC (P < 0.05) [Table 4].
Moreover, patients within each group were divided into In female groups, we found that levels of serum UA in
male and female subgroups to eliminate the gender female CNSI (214.97 ± 107.18 μmol/L) were also lower
effect. Least significant difference t-test was used to than female HC (252.13 ± 88.43 μmol/L, P = 0.018,
test distinction between each two groups. Table 3). Equally, in each group of female CNSI,
264 Neuroimmunology and Neuroinflammation ¦ Volume 3 ¦ December 15, 2016