
Page 121 - Read Online
P. 121
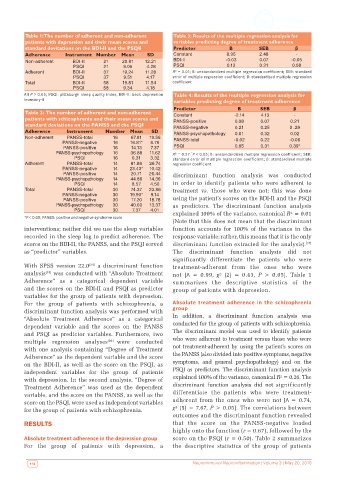
Table 1: The number of adherent and non-adherent    Table 3: Results of the multiple regression analysis for
          patients with depression and their mean scores and   variables predicting degree of treatment adherence
          standard devitations on the BDI-II and the PSQII    Predictor           B         SEB          β
          Adherence     Instrument Number   Mean     SD       Constant           8.95       2.48         -
          Non-adherent     BDI-II    21     20.81   12.21     BDI-II            -0.03       0.07       -0.05
                           PSQI      21     9.05     4.28     PSQI               0.13       0.21        0.08
          Adherent         BDI-II    37     19.24   11.28     R² = 0.01; B: unstandardized multiple regression coefficient; SEB: standard
                           PSQI      37     9.51    4.17      error of multiple regression coefficient; β: standardized multiple regression
          Total            BDI-II    58     19.81   11.54     coefficient
                           PSQI      58     9.34    4.18
          All P > 0.05; PSQI: pittsburgh sleep quality index; BDI-II: beck depression   Table 4: Results of the multiple regression analysis for
          inventory-II                                        variables predicting degree of treatment adherence
                                                              Predictor             B       SEB         β
          Table 2: The number of adherent and non-adherent    Constant             -2.14     4.13       -
          patients with schizophrenia and their mean scores and   PANSS-positive    0.08     0.07      0.21
          standard deviations on the PANSS and the PSQI       PANSS-negative        0.21     0.25      0 .29
          Adherence     Instrument    Number   Mean   SD      PANSS-psychopathology  0.01    0.32      0.02
          Non-adherent   PANSS-total     16    67.81  19.56   PANSS-total          -0.02     0.22      -0.06
                       PANSS-negative    16    16.81*  6.76
                       PANSS-positive    16    14.13  7.37    PSQI                  0.65     0.31      0.39*
                     PANSS-psychopathology  16  36.88  11.62  R² = 0.27  P < 0.05; B: unstandardized multiple regression coefficient; SEB:
                                                                    *
                           PSQI          16    6.31   3.32    standard error of multiple regression coefficient; β: standardized multiple
          Adherent       PANSS-total     14    81.86  26.74   regression coefficient
                       PANSS-negative    14    23.43*  10.42
                       PANSS-positive    14    20.71  26.44   discriminant function analysis was conducted
                     PANSS-psychopathology  14  44.86  14.36
                           PSQI          14    8.57   4.50    in order to identify patients who were adherent to
          Total          PANSS-total     30    74.37  23.86   treatment  vs. those who were not; this was done
                       PANSS-negative    30    19.90*  9.14
                       PANSS-positive    30    17.20  18.78   using the patient’s scores on the BDI-II and the PSQI
                     PANSS-psychopathology  30  40.60  13.37  as predictors. The discriminant function analysis
                           PSQI          30    7.37   4.01    explained 100% of the variance, canonical R² = 0.01
          *P < 0.05; PANSS: positive and negative syndrome scale
                                                              (Note that this does not mean that the discriminant
          interventions; neither did we use the sleep variables   function accounts for 100% of the variance in the
          recorded in the sleep log to predict adherence. The   response variable; rather, this means that it is the only
          scores on the BDI-II, the PANSS, and the PSQI served   discriminant function extracted for the analysis). [37]
          as “predictor” variables.                           The discriminant function analysis did not
                                                              significantly differentiate the patients who were
          With SPSS version 22.0 [34]  a discriminant function   treatment-adherent from the ones who were
          analysis [35]  was conducted with “Absolute Treatment   not  [Λ =  0.99,  χ² (2) = 0.43,  P >  0.05]. Table  1
          Adherence” as a categorical dependent variable      summarizes the descriptive statistics of the
          and the scores on the BDI-II and PSQI as predictor   group of patients with depression.
          variables for the group of patients with depression.
          For the group of patients with schizophrenia, a     Absolute  treatment  adherence  in  the  schizophrenia
          discriminant function analysis was performed with   group
          “Absolute  Treatment  Adherence”  as  a  categorical   In addition, a discriminant function analysis was
          dependent variable and the scores on the PANSS      conducted for the group of patients with schizophrenia.
          and  PSQI  as  predictor  variables.  Furthermore,  two   The  discriminant model was  used  to  identify  patients
          multiple regression analyses [36]   were conducted   who were adherent to treatment versus those who were
          with one analysis containing “Degree of Treatment   not treatment-adherent by using the patient’s scores on
          Adherence” as the dependent variable and the score   the PANSS (also divided into positive symptoms, negative
          on the BDI-II, as well as the score on the PSQI, as   symptoms, and general psychopathology) and on the
          independent  variables  for  the  group  of  patients   PSQI as predictors. The discriminant function analysis
          with depression. In the second analysis, “Degree of   explained 100% of the variance, canonical R² = 0.26. The
          Treatment Adherence” was used as the dependent      discriminant function analysis did not significantly
          variable, and the score on the PANSS, as well as the   differentiate the patients who were treatment-
          score on the PSQI, were used as independent variables   adherent from the ones who were not  [Λ  = 0.74,
          for the group of patients with schizophrenia.       χ² (5) = 7.67, P > 0.05]. The correlations between
                                                              outcomes and the discriminant function revealed
          RESULTS                                             that the score on the PANSS-negative loaded
                                                              highly onto the function (r = 0.67), followed by the
          Absolute treatment adherence in the depression group  score on the PSQI (r = 0.50). Table 2 summarizes
          For the group of patients with depression, a        the  descriptive statistics of the group of patients


           112                                                       Neuroimmunol Neuroinflammation | Volume 3 | May 20, 2016