
Page 109 - Read Online
P. 109
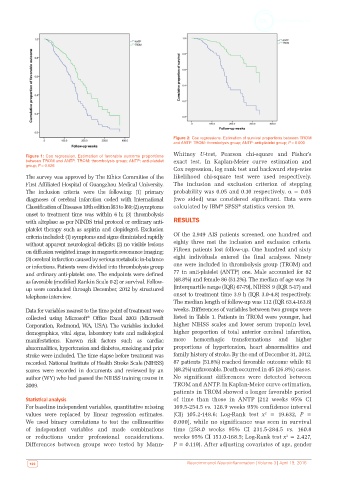
Figure 2: Cox regressions. Estimation of survival proportions between TROM
                                                              and ANTP. TROM: thrombolysis group; ANTP: anti-platelet group; P = 0.000
                                                              Whitney  U-test, Pearson chi-square and Fisher’s
          Figure 1: Cox regression. Estimation of favorable outcome proportions
          between TROM and ANTP. TROM: thrombolysis group; ANTP: anti-platelet   exact test. In Kaplan-Meier curve estimation and
          group; P = 0.026
                                                              Cox regression, log rank test and backward step-wise
          The survey was approved by The Ethics Committee of the   likelihood chi-square test were used respectively.
          First Affiliated Hospital of Guangzhou Medical University.   The inclusion and  exclusion criterion  of stepping
          The  inclusion  criteria were  the  following:  (1) primary   probability was 0.05 and 0.10 respectively. α = 0.05
          diagnoses of cerebral infarction coded with International   (two sided) was considered significant. Data were
                                                                              ®
          Classification of Diseases 10th edition I63 to I69; (2) symptoms   calculated by IBM  SPSS  statistics version 19.
                                                                                     ®
          onset to treatment time was within 6 h; (3) thrombolysis
          with alteplase as per NINDS trial protocol or ordinary anti-  RESULTS
          platelet therapy such as aspirin and clopidegrel. Exclusion
          criteria included: (1) symptoms and signs diminished rapidly   Of the 2,949 AIS patients screened, one hundred and
          without apparent neurological deficits; (2) no visible lesions   eighty three met the inclusion and exclusion criteria.
          on diffusion weighted image in magnetic resonance imaging;   Fifteen patients lost follow-up. One hundred and sixty
          (3) cerebral infarction caused by serious metabolic in-balance   eight individuals entered the final analyses. Ninety
          or infections. Patients were divided into thrombolysis group   one were included in thrombolysis group (TROM) and
          and ordinary anti-platelet one. The endpoints were defined   77 in anti-platelet (ANTP) one. Male accounted for 82
          as favorable (modified Rankin Scale 0-2) or survival. Follow-  (48.8%) and female 86 (51.2%). The median of age was 74
          up were conducted through December, 2012 by structured   [interquartile range (IQR) 67-79], NIHSS 9 (IQR 5-17) and
          telephone interview.                                onset to treatment time 3.9 h (IQR 3.0-4.8) respectively.
                                                              The median length of follow-up was 112 (IQR 63.4-163.8)
          Data for variables nearest to the time point of treatment were   weeks. Differences of variables between two groups were
          collected using Microsoft  Office Excel 2003 (Microsoft   listed in Table 1. Patients in TROM were younger, had
                                ®
          Corporation, Redmond, WA, USA). The variables included   higher  NIHSS  scales  and  lower  serum  troponin  level,
          demographics, vital signs, laboratory tests and radiological   higher proportion of total anterior cerebral infarction,
          manifestations.  Known risk factors such as cardiac   more  hemorrhagic  transformations  and  higher
          abnormalities, hypertension and diabetes, smoking and prior   proportions of hypertension, heart abnormalities and
          stroke were included. The time elapse before treatment was   family history of stroke. By the end of December 31, 2012,
          recorded. National Institute of Health Stroke Scale (NIHSS)   87 patients (51.8%) reached favorable outcome while 81
          scores were recorded in documents and reviewed by an   (48.2%) unfavorable. Death occurred in 45 (26.8%) cases.
          author (WY) who had passed the NIHSS training course in   No significant differences were detected between
          2009.                                               TROM and ANTP. In Kaplan-Meier curve estimation,
                                                              patients in TROM showed a longer favorable period
          Statistical analysis                                of time than those in ANTP [212 weeks 95% CI
          For baseline independent variables, quantitative missing   169.5-254.5 vs. 126.9 weeks 95% confidence interval
                                                                                              2
          values  were  replaced  by  linear  regression  estimates.   (CI) 105.2-148.6; Log-Rank test  x  = 19.632,  P =
          We used binary correlations to test the collinearities   0.000],  while no  significance was seen in  survival
          of independent variables and made combinations      time (258.0 weeks 95% CI 231.5-284.5  vs. 160.8
                                                                                                      2
          or  reductions  under  professional  considerations.   weeks 95% CI 153.0-168.5; Log-Rank test x  = 2.427,
          Differences between groups were tested  by Mann-    P = 0.119). After adjusting covariates of age, gender


           100                                                       Neuroimmunol Neuroinflammation | Volume 3 | April 19, 2016