
Page 45 - Read Online
P. 45
Chlorpyrifos oxon administration to the transgenic APP Administration of chlorpyrifos oxon enhances inflammation
mice at all-time points increased both brain Aβ 1-40 and and oxidative stress in the brain of amyloid precursor
Aβ compared with control APP mice [Figure 6a and b]. protein mice
1-42
The CPO treatment caused an increase in brain CTF-β In order to help determine the role of CPO on AD,
levels relative to controls [Figure 6c and d]. The we determined its impact on inflammatory markers
CPO treatment reduced sAPPα levels relative to in the brain following treatment. Brain samples from
controls [Figure 6e and f]. the control APP and CPO treated mice were examined
for the cytokines tumor necrosis factor-α (TNF-α),
Since CTF-β is a β-secretase cleavage product, an interleukin 1β (IL-1β) and IL-6 levels at the termination
increase in CTF-β resulting from CPO treatment in the of the study [Figure 7a-c]. All the treatment groups
APP mice suggests that β-secretase activity is increased showed a significant elevation in the cytokine levels
following administration of CPO. Increased production compared to the control APP mice [Table 2]. In addition,
of CTF-β from APP in CPO-treated mice is likely to result weaned APP mice were fed CPO (1 mg/kg) and then
in decreased APP available for α-secretase leading to a examined at various times up to 12 months for TNF-α
decrease in sAPPα [Table 1]. levels [Figure 7d]. As seen in the figure, animals treated
a b
c d
e
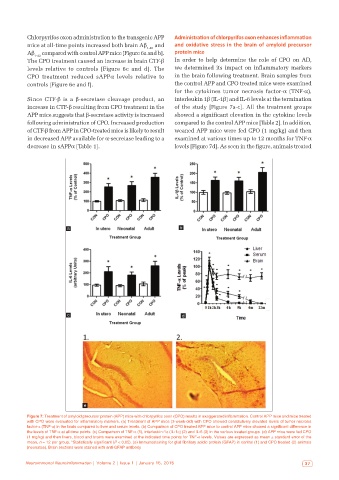
Figure 7: Treatment of amyloid precursor protein (APP) mice with chlorpyrifos oxon (CPO) results in exaggerated inflammation. Control APP mice and mice treated
with CPO were evaluated for inflammatory markers. (a) Treatment of APP mice (3-week-old) with CPO showed constitutively elevated levels of tumor necrosis
factor‑α (TNF‑α) in the brain compared to liver and serum levels. (b) Comparison of CPO treated APP mice to control APP mice showed a significant difference in
the levels of TNF‑α at all‑time points. (c) Comparison of TNF‑α (1), interleukin‑1α (IL‑1α) (2) and IL‑6 (3) in the various treated groups. (d) APP mice were fed CPO
(1 mg/kg) and then livers, blood and brains were examined at the indicated time points for TNF‑α levels. Values are expressed as mean ± standard error of the
mean, n = 12 per group. *Statistically significant (P < 0.05). (e) Immunostaining for glial fibrillary acidic protein (GFAP) in control (1) and CPO treated (2) animals
(neonates). Brain sections were stained with anti‑GFAP antibody
Neuroimmunol Neuroinflammation | Volume 2 | Issue 1 | January 15, 2015 37