
Page 44 - Read Online
P. 44
a b c
d e f g
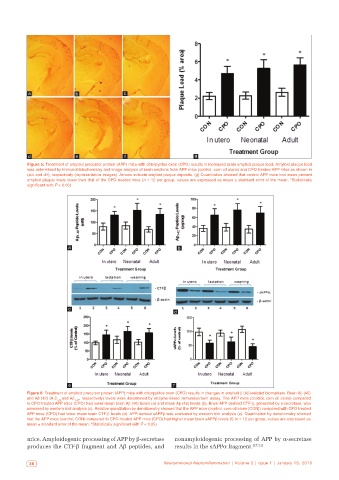
Figure 5: Treatment of amyloid precursor protein (APP) mice with chlorpyrifos oxon (CPO) results in increased brain amyloid plaque load. Amyloid plaque load
was determined by immunohistochemistry and image analysis of brain sections from APP mice (control, corn oil alone) and CPO treated APP mice as shown in
(a‑c and d‑f), respectively (representative images). Arrows indicate amyloid plaque deposits. (g) Quantitation showed that control APP mice had mean percent
amyloid plaque loads lower than that of the CPO treated mice (n = 12 per group, values are expressed as mean ± standard error of the mean, *Statistically
significant with P < 0.05)
a b
c
d
e f
Figure 6: Treatment of amyloid precursor protein (APP) mice with chlorpyrifos oxon (CPO) results in changes in amyloid β (Aβ)‑related biomarkers. Brain Aβ (40)
and Aβ (42) (A‑β 1-40 and Aβ 1‑42 , respectively) levels were determined by enzyme‑linked immunosorbent assay. The APP mice (control, corn oil alone) compared
to CPO‑treated APP mice (CPO) had lower mean brain Aβ (40) levels (a) and mean Aβ (42) levels (b). Brain APP‑derived CTF‑β, generated by β‑secretase, was
assessed by western blot analysis (c). Relative quantitation by densitometry showed that the APP mice (control, corn oil alone [CON]) compared with CPO treated
APP mice (CPO) had lower mean brain CTF‑β levels (d). APP‑derived sAPPβ was evaluated by western blot analysis (e). Quantitation by densitometry showed
that the APP mice (control, CON) compared to CPO‑treated APP mice (CPO) had higher mean brain sAPPβ levels (f) (n = 12 per group, values are expressed as
mean ± standard error of the mean, *Statistically significant with P < 0.05)
mice. Amyloidogenic processing of APP by β-secretase nonamyloidogenic processing of APP by α-secretase
produces the CTF-β fragment and Aβ peptides, and results in the sAPPα fragment. [27,31]
36 Neuroimmunol Neuroinflammation | Volume 2 | Issue 1 | January 15, 2015