
Page 20 - Read Online
P. 20
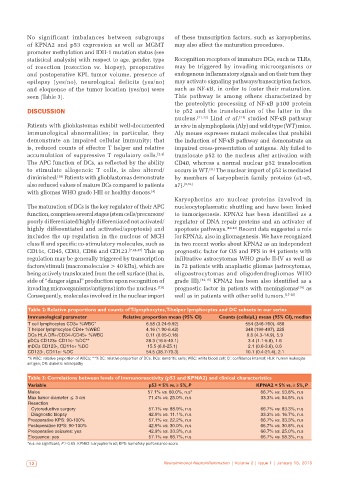
No significant imbalances between subgroups        of these transcription factors, such as karyopherins,
           of KPNA2 and p53 expression as well as MGMT        may also affect the maturation procedures.
           promoter methylation and IDH-1 mutation status (see
           statistical analysis) with respect to age, gender, type   Recognition receptors of immature DCs, such as TLRs,
           of  resection  (resection  vs.  biopsy),  preoperative   may be triggered by invading microorganisms or
           and postoperative KPI, tumor volume, presence of   endogenous inflammatory signals and on their turn they
           epilepsy  (yes/no), neurological deficits  (yes/no)   may activate signaling pathways/transcription factors,
           and eloquence of the tumor location (yes/no) were   such as NF-κB, in order to foster their maturation.
           seen [Table 3].                                    This pathway is among others characterized by
                                                              the  proteolytic  processing  of  NF-κB  p100  protein
           DISCUSSION                                         to p52 and the translocation of the latter in the
                                                              nucleus. [31,32]  Lind  et  al. [31]  studied NF-κB pathway
           Patients with glioblastomas exhibit well-documented   in vivo in alymphoplasia (Aly) and wild type (WT) mice.
           immunological  abnormalities; in  particular, they   Aly mouse expresses mutant molecules that prohibit
           demonstrate an impaired cellular immunity; that    the induction of NF-κB pathway and demonstrate an
           is, reduced counts of effector T helper and relative   impaired cross-presentation of antigens. Aly failed to
           accumulation of suppressive T regulatory cells. [2,4]    translocate p52 to the nucleus after activation with
           The APC function of DCs, as reflected by the ability   CD40, whereas a normal nuclear p52 translocation
           to stimulate allogeneic T cells, is also altered/  occurs in WT. [31]  The nuclear import of p52 is mediated
           diminished.  Patients with glioblastomas demonstrate   by members of karyopherin family proteins (a1-a5,
                     [30]
           also reduced values of mature DCs compared to patients   a7). [9,32]
           with gliomas WHO grade I-III or healthy donors. [4]
                                                              Karyopherins are nuclear proteins involved in
           The maturation of DCs is the key regulator of their APC   nucleocytoplasmatic shuttling and have been linked
           function, comprises several stages (stem cells/precursors/  to tumorigenesis. KPNA2 has been identified as a
           poorly differentiated/highly differentiated not activated/  regulator of DNA repair proteins and an activator of
           highly differentiated and activated/apoptosis) and   apoptosis pathways. [10-13]  Recent data suggested a role
           includes the up regulation in the nucleus of MCH   for KPNA2, also in gliomagenesis. We have recognized
           class II and specific co-stimulatory molecules, such as   in two recent works about KPNA2 as an independent
           CD11c, CD45, CD83, CD86 and CD123. [7,24-27]  This up   prognostic factor for OS and PFS in 94 patients with
           regulation may be generally triggered by transcription   infiltrative astrocytomas WHO grade II-IV as well as
           factors/stimuli (macromolecules > 40 kDa), which are   in 72 patients with anaplastic gliomas (astrocytomas,
           being actively translocated from the cell surface (that is,   oligoastrocytomas and oligodendrogliomas WHO
           side of “danger signal” production upon recognition of   grade III). [14,15]  KPNA2 has been also identified as a
           invading microorganisms/antigens) into the nucleus. [7,8]    prognostic factor in patients with meningiomas [16]  as
           Consequently, molecules involved in the nuclear import   well as in patients with other solid tumors. [17-20]

           Table 2: Relative proportions and counts of T‑lymphocytes, T‑helper lymphocytes and DC subsets in our series
           Immunological parameter          Relative proportion mean (95% CI)  Counts (cells/μL) mean (95% CI), median
           T cell lymphocytes CD3+ %WBC*            6.58 (3.24‑9.92)                   554 (348‑760), 488
           T helper lymphocytes CD4+ %WBC           4.16 (1.90‑6.42)                   348 (199‑497), 225
           DCs HLA DR+/CD34‑/CD45+ %WBC             0.11 (0.05‑0.16)                    9.6 (4.3‑14.9), 5.9
           pDCs CD123+ CD11c‑ %DC**                 28.3 (16.5‑40.1)                    3.4 (1.1‑5.8), 1.6
           mDCs CD123‑, CD11c+ %DC                   15.5 (6.0‑25.1)                    2.1 (0.6‑3.6), 0.6
           CD123‑, CD11c‑ %DC                       54.5 (38.7‑70.3)                   10.1 (0.4‑21.4), 2.1
           *% WBC: relative proportion of WBCs; **% DC: relative proportion of DCs. DCs: dendritic cells; WBC: white blood cell; CI: confidence interval; HLA: human leukocyte
           antigen; DR: diabetic retinopathy

           Table 3: Correlations between levels of immunoreactivity (p53 and KPNA2) and clinical characteristics
           Variable                                  p53 < 5% vs. ≥ 5%, P                  KPNA2 < 5% vs. ≥ 5%, P
           Males                                     57.1% vs. 60.0%, n.s*                   66.7% vs. 53.8%, n.s
           Max tumor diameter ≤ 3 cm                 71.4% vs. 25.0%, n.s                    33.3% vs. 54.5%, n.s
           Resection
            Cytoreductive surgery                    57.1% vs. 88.9%, n.s                    66.7% vs. 83.3%, n.s
            Diagnostic biopsy                        42.9% vs. 11.1%, n.s                    33.3% vs. 16.7%, n.s
           Preoperative KPS: 90‑100%                 57.1% vs. 22.2%, n.s                    66.7% vs. 33.3%, n.s
           Postoperative KPS: 90‑100%                42.9% vs. 30.0%, n.s                    66.7% vs. 30.8%, n.s
           Preoperative seizures: yes                42.9% vs. 33.3%, n.s                    66.7% vs. 25.0%, n.s
           Eloquence: yes                            57.1% vs. 66.7%, n.s                    66.7% vs. 58.3%, n.s
           *n.s: no significant; P > 0.05. KPNA2: karyopherin a2; KPS: karnofsky performance score


            12                                             Neuroimmunol Neuroinflammation | Volume 2 | Issue 1 | January 15, 2015