
Page 19 - Read Online
P. 19
significant. Cut-off values for nonparametric statistics secondary glioblastomas. Representative results of
were set at the median of each variable, that is, the KPNA-, p53- and IDH-1-immunohistochemistry are
studied subgroups were as following KPNA2: < 5% vs. ≥ shown in Figure 1. MGMT promoter hypermethylation
5% positive cell nuclei; p53: < 5% vs. ≥ 5% positive cell was observed in 1/9 tumors [Figure 2].
nuclei; total mature DC: < 5.9 vs. ≥ 5.9 cells/μL; pDC: <
1.6 vs. ≥ 1.6 cells/μL; mDC: < 0.6 vs. ≥ 0.6 cells/μL; age: A preliminary analysis suggests an association
< 54 vs. ≥ 54; preoperative and postoperative Karnofsky between lower KPNA2 nuclear expression and
performance index (KPI): < 90 vs. ≥ 90. increased numbers of mature DC. All patients with
low KPNA2 (< 5%) expression and only 33.3% of
RESULTS patients with KPNA2 ≥ 5% demonstrated counts of
mature DCs over the median (≥ 5.9 cells/μL). However,
The relative proportions of total mature DCs as well as this correlation did not reach statistical significance so
subsets of mature DCs in patients with glioblastomas far (total mature DC ≥ 5.9 cells/μL: KPNA2 < 5% vs.
were as following: total DCs as proportion of WBC: ≥ 5%/100% vs. 33.3%, Pearson’s Chi-square: P = 0.038,
0.11% (0.05-0.16%), pDC CD123+ CD11c- as Fisher’s exact test: P = 0.077, both two-sided; Fisher’s
proportion of total DCs: 28.3% (16.5-40.1%), mDC exact test is most appropriate, since study population
CD123- CD11c+ as proportion of total DC: 15.5% (6.0- is limited) [Figure 4].
25.1%), CD123-CD11c- as proportion of total DCs:
54.5% (38.7-70.3%). Similarly, counts (mean, 95% CI, A trend between KPNA2 expression and IDH-R132H
median) (cells/μL) of mature DCs were: total mature DCs: mutation status has been observed. Patients expressing
9.6 (4.3-14.9), 5.9, pDC CD123+ CD11c-: 3.4 (1.1-5.8), lower KPNA2 exhibit also frequently mutant
1.6, mDC CD123- CD11c+: 2.1 (0.6-3.6), 0.6 [Table 2]. IDH-1-R132H (mutant IDH-1-R132H: KPNA2 < 5% vs.
≥ 5%/66.7% vs. 7.7%, Pearson’s Chi-square: P = 0.018,
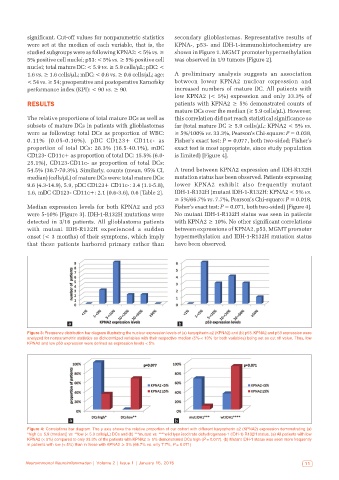
Median expression levels for both KPNA2 and p53 Fisher’s exact test: P = 0.071, both two-sided) [Figure 4].
were 5-10% [Figure 3]. IDH-1-R132H mutations were No mutant IDH-1-R132H status was seen in patients
detected in 3/16 patients. All glioblastoma patients with KPNA2 ≥ 10%. No other significant correlations
with mutant IDH-R132H experienced a sudden between expressions of KPNA2, p53, MGMT promoter
onset (< 3 months) of their symptoms, which imply hypermethylation and IDH-1-R132H mutation status
that these patients harbored primary rather than have been observed.
a b
Figure 3: Frequency distribution bar diagram illustrating the nuclear expression levels of (a) karyopherin a2 (KPNA2) and (b) p53. KPNA2 and p53 expression were
analyzed for nonparametric statistics as dichotomized variables with their respective median (5%‑< 10% for both variables) being set as cut off value. Thus, low
KPNA2 and low p53 expression were defined as expression levels < 5%
a b
Figure 4: Correlations bar diagram. The y axis shows the relative proportion of our cohort with different karyopherin a2 (KPNA2) expression demonstrating (a)
*high (≥ 5.9 (median)] vs. **low (< 5.9 cells/μL) DCs and (b) ***mutant vs. ****wild type isocitrate dehydrogenase‑1 (IDH‑1) R132H status. (a) All patients with low
KPNA2 (< 5%) compared to only 33.3% of the patients with KPNA2 ≥ 5% demonstrated DCs high (P = 0.077). (b) Mutant IDH‑1 status was seen more frequently
in patients with low (< 5%) than in those with KPNA2 ≥ 5% (66.7% vs. only 7.7%, P = 0.071)
Neuroimmunol Neuroinflammation | Volume 2 | Issue 1 | January 15, 2015 11