
Page 93 - Read Online
P. 93
characterization: F = 23.86, P = 0.000; cell body to cell size ratio as validated measure of microglial
3,56
to cell size ration: F 3,56 = 22.48, P = 0.000). Both activation.
of these measures for microglial activation show a
similar pattern, with both groups of old rats showing In this study, we compare different analysis methods
increased microglial activation when compared to for IBA-1 stained brain sections of young and aged rats
their young counterparts and further increase of with or without surgery. Surgery has been associated
[17]
microglial activation observed only in operated old with the development of postoperative cognitive
rats. dysfunction (POCD), including impairment of memory,
attention, and executive functions. [19-22] Accumulating
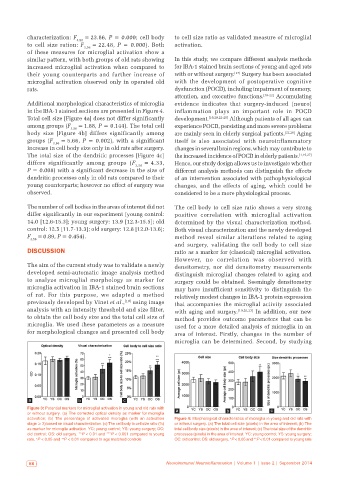
Additional morphological characteristics of microglia evidence indicates that surgery-induced (neuro)
in the IBA-1 stained sections are presented in Figure 4. inflammation plays an important role in POCD
Total cell size [Figure 4a] does not differ significantly development. [19,20,22-25] Although patients of all ages can
among groups (F 3,56 = 1.88, P = 0.144). The total cell experience POCD, persisting and more severe problems
body size [Figure 4b] differs significantly among are mainly seen in elderly surgical patients. [22,26] Aging
groups (F 3,56 = 5.66, P = 0.002), with a significant itself is also associated with neuroinflammatory
increase in cell body size only in old rats after surgery. changes in several brain regions, which may contribute to
The total size of the dendritic processes [Figure 4c] the increased incidence of POCD in elderly patients. [1,19,27]
differs significantly among groups (F 3,56 = 4.33, Hence, our study design allows us to investigate whether
P = 0.008) with a significant decrease in the size of different analysis methods can distinguish the effects
dendritic processes only in old rats compared to their of an intervention associated with pathophysiological
young counterparts; however no effect of surgery was changes, and the effects of aging, which could be
observed. considered to be a more physiological process.
The number of cell bodies in the areas of interest did not The cell body to cell size ratio shows a very strong
differ significantly in our experiment (young control: positive correlation with microglial activation
14.0 [12.6-15.3]; young surgery: 13.9 [12.3-15.5]; old determined by the visual characterization method.
control: 12.5 [11.7-13.3]; old surgery: 12.8 [12.0-13.6]; Both visual characterization and the newly developed
F = 0.89, P = 0.454). method reveal similar alterations related to aging
3,56
and surgery, validating the cell body to cell size
DISCUSSION ratio as a marker for (classical) microglial activation.
However, no correlation was observed with
The aim of the current study was to validate a newly densitometry, nor did densitometry measurements
developed semi-automatic image analysis method distinguish microglial changes related to aging and
to analyze microglial morphology as marker for surgery could be obtained. Seemingly densitometry
microglia activation in IBA-1 stained brain sections may have insufficient sensitivity to distinguish the
of rat. For this purpose, we adapted a method relatively modest changes in IBA-1 protein expression
previously developed by Vinet et al., [10] using image that accompanies the microglial activity associated
analysis with an intensity threshold and size filter, with aging and surgery. [19,20,23] In addition, our new
to obtain the cell body size and the total cell size of method provides outcome parameters that can be
microglia. We used these parameters as a measure used for a more detailed analysis of microglia in an
for morphological changes and presented cell body area of interest. Firstly, changes in the number of
microglia can be determined. Second, by studying
a b c
Figure 3: Potential markers for microglial activation in young and old rats with a b c
or without surgery. (a) The corrected optical density as marker for microglia
activation; (b) The percentage of activated microglia (with an activation Figure 4: Morphological characteristics of microglia in young and old rats with
stage ≥ 3) based on visual characterization. (c) The cell body to cell size ratio (%) or without surgery. (a) The total cell size (pixels) in the area of interest; (b) The
as marker for microglia activation. YC: young control; YS: young surgery; OC: total cell body size (pixels) in the area of interest; (c) The total size of the dendritic
old control; OS: old surgery. **P < 0.01 and ***P < 0.001 compared to young processes (pixels) in the area of interest. YC: young control; YS: young surgery;
rats. P < 0.05 and P < 0.01 compared to age matched controls OC: old control; OS: old surgery. *P < 0.05 and **P < 0.01 compared to young rats
+
++
86 Neuroimmunol Neuroinflammation | Volume 1 | Issue 2 | September 2014