
Page 92 - Read Online
P. 92
Statistical analysis Table 1: Outcome measures microglial analysis
All statistical analyses were performed using SPSS (IBM n Mean (95% CI)
SPSS Statistics for Windows, 20.0.0.2, New York, USA). Activated microglia (stages 3‑5) (%) 60 40.4 (37.0‑43.9)
Means and confidence intervals are shown. Figures Optical density 60 0.17 (0.16‑0.18)
13.3 (12.7‑13.8)
were prepared by using GraphPad Prism (version 5.00 Number of microglia 60 2341 (2227‑2454)
Average cell size (pixels)
59
for Windows, GraphPad Software, San Diego, Average cell body size (pixels) 59 328 (302‑355)
California, USA). Pearson’s correlation coefficients Average size dendritic processes (pixels) 59 2013 (1910‑2116)
were determined to examine the relationship between Cell body to cell size ratio (%) 60 14.2 (13.2‑15.1)
the various measures for microglial activation for all Mean ± SEM of the outcome measures used to analyze microglial activation. Average
outcomes are representing an area of 0.06 mm × 0.06 mm in the CA1, dentate gyrus
individual brain areas, and all brain areas combined. inner blade and prefrontal cortex. The visual characterization outcomes and number of
[17]
The significance level for the Pearson’s correlation microglia have been previously published by Hovens et al. CA1: cornu ammonis 1; CI:
confidence interval, SEM: standard error of the mean
coefficients was corrected by using Bonferonni method.
In addition, group comparisons were made for microglial Table 2: Correlation between the percentages of
activated microglia based on visual characterization and
activation in the CA1, DGib and PFC combined, using the quantified morphological characteristics of microglia
an analysis of variance with the experimental group Morphological characteristics
as between subject factor followed by Tukey post-hoc Number Cell Cell Processes Cell
analysis. Outcomes were considered to be significant of cells size body size body/
when P < 0.05. size cell
Visual
RESULTS characterization 0.137 0‑0.449 0.625 # 0‑0.495 0.839*
DGib
CA1 0.001 0‑0.282 0.796* 0‑0.524 0.890*
Table 1 shows the average values of the outcome PFC 0‑0.390 0‑0.029 0.680* 0‑0.288 0.944*
measures used to analyze microglia activation. Total 0‑0.104 0‑0.170 0.619* 0‑0.343 # 0.855*
Correlation (Pearson’s R) between the percentage of activated microglia as
determined by visual characterization according to Kreutzberg and the quantified
The image analysis by Image-Pro and ImageJ yielded morphological characteristics of microglia in the DGib (n = 20), hippocampal CA1
highly comparable results as indicated by a strong region (n = 20), PFC (n = 20) and all three brain areas combined (total,
n = 60). The morphological characteristics are: the number of microglia (number
correlation of the main outcome parameters cell of cells), the average size of microglia (cell size), the average cell body size
body size (r = 0.792, P = 0.000), size of dendritic of microglia (cell body size), the average size of the dendritic processes of
processes (r = 0.499, P = 0.029) and cell body to cell microglia (processes size) and the cell body to cell size ratio (cell body/cell) in
the area of interest. *P < 0.0013, P = 0.01. PFC: prefrontal cortex; CA1: cornu
#
size ratio (r = 0.918, P = 0.000). Therefore, we have ammonis 1; PFC: prefrontal cortex; DGib: dentate gyrus inner blade
only used the outcomes of the analysis with Image-Pro
for the rest of the study.
There is no significant correlation between OD and
the other parameters used to measure microglia
activation. The Pearson’s correlations between the
percentages of activated microglia based on visual
characterization and the quantified morphological
characteristics are shown in Table 2. In all separate
brain area, the parameter of the cell body to cell size
ratio is significantly and strongly correlated with
microglial activation based on visual characterization.
Therefore, this outcome may be a more accurate
morphological characteristic to represent a marker
of (classical) microglial activation.
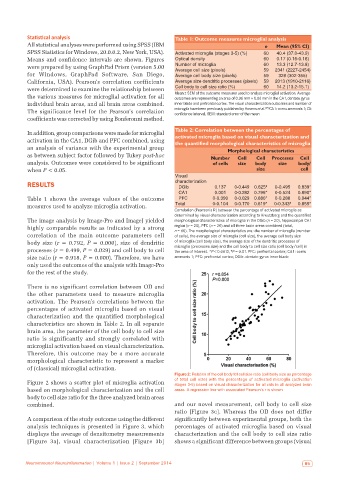
Figure 2: Relation of the cell body tot cell size ratio (cell body size as percentage
of total cell size) with the percentage of activated microglia (activation
Figure 2 shows a scatter plot of microglia activation stages 3‑5) based on visual characterization for all rats in all analyzed brain
based on morphological characterization and the cell areas. A regression line with associated Pearson’s r is shown
body to cell size ratio for the three analyzed brain areas
combined. and our novel measurement, cell body to cell size
ratio [Figure 3c]. Whereas the OD does not differ
A comparison of the study outcome using the different significantly between experimental groups, both the
analysis techniques is presented in Figure 3, which percentages of activated microglia based on visual
displays the average of densitometry measurements characterization and the cell body to cell size ratio
[Figure 3a], visual characterization [Figure 3b] shows a significant difference between groups (visual
Neuroimmunol Neuroinflammation | Volume 1 | Issue 2 | September 2014 85