
Page 91 - Read Online
P. 91
microglia expressed as a percentage of the total an intensity threshold will filter out most dendritic
number of microglia was used as a measure for processes from the analysis. In addition, the size filter
microglial activation. excludes all pixel clusters that are smaller than a
certain size from the analysis, filtering out any dendritic
Quantifying morphological characteristics (cell size, cell processes with a high-staining intensity. The intensity
body size, size dendritic processes and cell body size to cell threshold and size filter depend on the overall intensity
size ratio) of the staining. In our case, the intensity threshold was
As described in the previous section, images were taken 150-170 and the size filter was 100 pixels.
of the DGib, CA1 and PFC of the IBA-1 stained sections.
Several morphological characteristics of the stained In addition, the number of cell bodies was counted to
microglia were analyzed by using image analysis give the number of microglia in the area of interest. The
software (Image-Pro Plus 6.0.0.26, Media Cybernetics, total size of the dendritic processes was determined
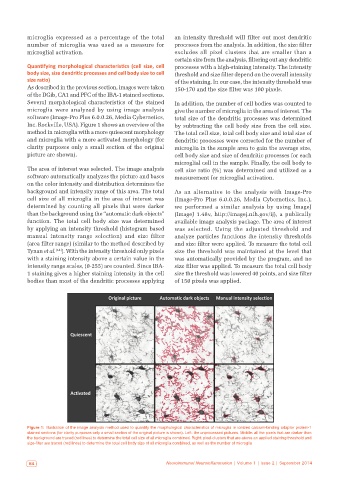
Inc. Rockville, USA). Figure 1 shows an overview of the by subtracting the cell body size from the cell size.
method in microglia with a more quiescent morphology The total cell size, total cell body size and total size of
and microglia with a more activated morphology (for dendritic processes were corrected for the number of
clarity purposes only a small section of the original microglia in the sample area to gain the average size,
picture are shown). cell body size and size of dendritic processes for each
microglial cell in the sample. Finally, the cell body to
The area of interest was selected. The image analysis cell size ratio (%) was determined and utilized as a
software automatically analyzes the picture and bases measurement for microglial activation.
on the color intensity and distribution determines the
background and intensity range of this area. The total As an alternative to the analysis with Image-Pro
cell size of all microglia in the area of interest was (Image-Pro Plus 6.0.0.26, Media Cybernetics, Inc.),
determined by counting all pixels that were darker we performed a similar analysis by using ImageJ
than the background using the “automatic dark objects” (ImageJ 1.48v, http://imagej.nih.gov/ij), a publically
function. The total cell body size was determined available image analysis package. The area of interest
by applying an intensity threshold (histogram based was selected. Using the adjusted threshold and
manual intensity range selection) and size filter analyze particles functions the intensity thresholds
(area filter range) (similar to the method described by and size filter were applied. To measure the total cell
Tynan et al. ). With the intensity threshold only pixels size the threshold was maintained at the level that
[18]
with a staining intensity above a certain value in the was automatically provided by the program, and no
intensity range scales, (0-255) are counted. Since IBA- size filter was applied. To measure the total cell body
1 staining gives a higher staining intensity in the cell size the threshold was lowered 40 points, and size filter
bodies than most of the dendritic processes applying of 150 pixels was applied.
Figure 1: Illustration of the image analysis method used to quantify the morphological characteristics of microglia in ionized calcium‑binding adaptor protein‑1
stained sections (for clarity purposes only a small section of the original picture is shown). Left: the unprocessed pictures. Middle: all the pixels that are darker than
the background are traced (red lines) to determine the total cell size of all microglia combined. Right: pixel‑clusters that are above an applied staining threshold and
size-filter are traced (red lines) to determine the total cell body size of all microglia combined, as well as the number of microglia
84 Neuroimmunol Neuroinflammation | Volume 1 | Issue 2 | September 2014