
Page 163 - Read Online
P. 163
increased IL‑1β (P < 0.009), IL‑1R1 (P < 0.002) and statistically different between femur injections.
COX‑2 (P < 0.003) mRNA expression compared Similar findings were obtained in C57/Bl6 wild‑type
with vehicle‑treated animals [Table 2]. Spinal gene mice [Figure 5a]. The signal was specific since no
expression was not found to be different between femur labeling was observed in CCR2‑C57/Bl6 knockout
injections, except for a decrease in TNFR1 expression mice, except for some interstitial staining [Figure 5b].
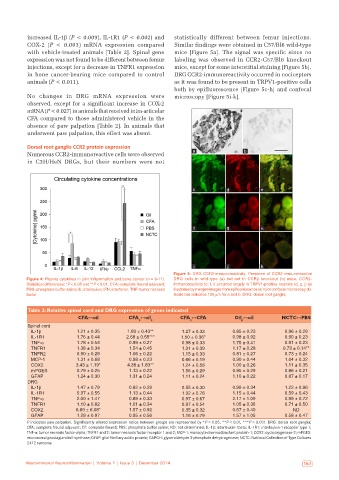
in bone cancer‑bearing mice compared to control DRG CCR2‑immunoreactivity occurred in nociceptors
animals (P < 0.011). as it was found to be present in TRPV1‑positive cells
both by epifluorescence [Figure 5c‑h] and confocal
No changes in DRG mRNA expression were microscopy [Figure 5i‑k].
observed, except for a significant increase in COX‑2
mRNA (P < 0.027) in animals that received intra‑articular
CFA compared to those administered vehicle in the
absence of paw palpation [Table 2]. In animals that
underwent paw palpation, this effect was absent.
Dorsal root ganglia CCR2 protein expression
Numerous CCR2‑immunoreactive cells were observed a b
in C3H/HeN DRGs, but their numbers were not
c d e
f g h
i j k
Figure 5: DRG CCR2‑immunoreactivity. Presence of CCR2‑immunoreactive
Figure 4: Plasma cytokines in joint inflammation and bone cancer (n = 9‑11). DRG cells in wild‑type (a) but not in CCR2 knockout (b) mice. CCR2‑
Statistical differences: *P < 0.05 and **P < 0.01. CFA: complete freund adjuvant; immunoreactivity (c; f; i) occurred largely in TRPV1‑positive neurons (d, g, j) as
PBS: phosphate buffer saline; IL: interleukin; IFN: interferon; TNF: tumor necrosis illustrated by merged images from epifluorescence (e; h) or confocal microscopy (k).
factor Scale bar indicates 100 µm for a and b. DRG: dorsal root ganglia
Table 2: Relative spinal cord and DRG expression of genes indicated
CFA↔oil CFA ↔oil p CFA ↔CFA Oil ↔oil NCTC↔PBS
p
p
p
Spinal cord
IL‑1β 1.21 ± 0.35 1.80 ± 0.43** 1.27 ± 0.33 0.85 ± 0.23 0.96 ± 0.29
IL‑1R1 1.76 ± 0.44 2.68 ± 0.55*** 1.50 ± 0.36* 0.98 ± 0.92 0.90 ± 0.23
TNF‑ɑ 1.78 ± 0.54 0.99 ± 0.27 0.98 ± 0.33 1.75 ± 0.41 0.91 ± 0.23
TNFR1 1.38 ± 0.34 1.54 ± 0.45 1.31 ± 0.39 1.17 ± 0.28 0.73 ± 0.14**
TNFR2 0.90 ± 0.29 1.06 ± 0.22 1.15 ± 0.33 0.81 ± 0.27 0.73 ± 0.24
MCP‑1 1.31 ± 0.68 0.98 ± 0.23 0.66 ± 0.19 0.90 ± 0.44 1.04 ± 0.32
COX2 3.43 ± 1.19* 4.38 ± 1.83** 1.24 ± 0.58 1.00 ± 0.26 1.11 ± 0.35
mPGES 0.79 ± 0.25 1.13 ± 0.22 1.56 ± 0.29 0.95 ± 0.29 0.86 ± 0.21
GFAP 1.24 ± 0.30 1.31 ± 0.24 1.11 ± 0.24 1.10 ± 0.22 0.87 ± 0.17
DRG
IL‑1β 1.47 ± 0.79 0.82 ± 0.29 0.55 ± 0.30 0.99 ± 0.34 1.22 ± 0.96
IL‑1R1 0.97 ± 0.55 1.13 ± 0.44 1.32 ± 0.76 1.15 ± 0.44 0.59 ± 0.43
TNF‑ɑ 2.00 ± 1.47 0.89 ± 0.33 0.97 ± 0.67 2.17 ± 1.09 0.99 ± 0.72
TNFR1 1.10 ± 0.62 1.01 ± 0.34 0.97 ± 0.54 1.05 ± 0.35 0.71 ± 0.50
COX2 6.69 ± 6.08* 1.57 ± 0.92 0.35 ± 0.32 0.67 ± 0.40 ND
GFAP 1.29 ± 0.97 0.95 ± 0.56 1.16 ± 0.79 1.57 ± 1.05 0.58 ± 0.47
P indicates paw palpation. Significantly altered expression ratios between groups are represented by *P < 0.05, **P < 0.01, ***P < 0.001. DRG: dorsal root ganglia;
CFA: complete freund adjuvant; CF: complete freund; PBS: phosphate buffer saline; ND: not determined; IL‑1β: interleukin‑1beta; IL‑1R1: interleukin‑1 receptor type 1;
TNF‑ɑ: tumor necrosis factor‑alpha; TNFR1 and 2: tumor necrosis factor receptor 1 and 2; MCP‑1: monocyte chemoattractant protein‑1; COX2: cyclooxygenase‑2; mPGES:
microsomal prostaglandin E synthase; GFAP: glial fibrillary acidic protein; GAPGH: glyceraldehyde 3‑phosphate dehydrogenase; NCTC: National Collection of Type Cultures
2472 sarcoma
Neuroimmunol Neuroinflammation | Volume 1 | Issue 3 | December 2014 157