
Page 161 - Read Online
P. 161
were frozen at ‑80 °C. IL‑1β, IL‑6, IL‑12, MCP‑1/CCL2, Data representation and statistical analysis
TNF‑α and interferon‑gamma (IFN‑γ) were measured Data were expressed as mean ± standard error of mean
using a 6‑plex kit (BIORAD, Hercules, CA, USA). or in case of PCR experiments as mean ± standard
When estimated values were below the detection limit, error. Weekly food intake, body weight changes and
animals were excluded from the analysis. exploratory behaviors were analyzed with two‑way
repeated measures analysis of variances (ANOVAs).
Cytokine and cytokine receptor expression in the spinal cord Mechanical allodynia and spinal Fos expression
and dorsal root ganglias expression were analyzed with two‑way ANOVAs. Plasma
RNA was extracted with Trizol (Invitrogen, Carlsblad, cytokine concentrations were analyzed using t‑test.
CA, USA) and concentrations were measured using a Nonparametric Mann‑Whitney tests were performed
Nanodrop (Thermo scientific, Waltham, MA, USA). when normality or equal variance test failed.
Quality check was performed with a Bioanalyzer (Agilent Differences in spinal mRNA expression were analyzed
Technologies, Santa Clara, CA, USA) before reverse [40]
transcription to cDNA. Primers were designed [Table 1] with Pair‑Wise fixed reallocation randomization tests.
and the resulting amplicon was validated using melting In all cases, P < 0.05 was considered as a statistically
curve analysis. Real‑time SYBR green‑based comparative significant difference.
PCR was performed (DyNamoTM SYBER Green qPCR
Kit, Finnzymes Oy, Espoo, Finland). Animals were RESULTS
excluded from the analysis if melting curves did not
show a single peak. Relative expression of mRNA Two C57/Bl6 mice died during the second anesthesia
expression of IL‑1β, IL‑1 receptor type 1 (IL‑1R1), for intra‑articular injection of CFA or mineral oil.
TNF‑α, TNF receptor 1 and 2 (TNFR1 and 2), Magnetic resonance imaging
MCP‑1/CCL2, cyclooxygenase‑2 (COX‑2), prostaglandin T2‑weighted MRI indicated some stifle joint edema
E synthase and glial fibrillary acidic protein (GFAP) to after mineral oil injection [Figure 2a], but revealed
glyceraldehyde 3‑phosphate dehydrogenase expression much more intense and widespread inflammatory
was calculated as described by Pfaffl et al. [40]
edema after CFA administration [Figure 2b]. No signs
Although the constitutive expression of IL‑6 receptor of inflammation were observed in contralateral joints.
protein has convincingly been shown in DRG, [23,24] FLASH‑based MRI revealed intact bone and marrow
this is not necessarily the case for other cytokine after PBS injection into the femur intramedullary
receptors. Tyramide‑amplified (PerkinElmer, canal [Figure 2c], whereas NCTC tumor cell injection
Waltham, MA, USA) immunohistochemical detection resulted in trabecular bone destruction and irregular
of mouse CCR2 (rabbit antiserum diluted 1:25000, bone surfaces [Figure 2d].
Avia Systems Biology, San Diego, CA, USA) was
used on free‑floating 20 µm DRG cryostat sections Food intake and body weight
to study constitutive protein expression of the Food intake [Z = ‑2.520; P < 0.012; Figure 3a] and
MCP‑1/CCL2 receptor. Specificity of immunoreactivity body weight gain (Z = ‑2.588; P < 0.010) were
was assessed in CCR2‑C57/Bl6 knockout mice (Jackson significantly reduced during the week after CFA
Laboratory‑JAX Mice, Bar Harbor, USA). injection as compared to mineral oil. Weekly food intake
®
Double‑labelling for transient receptor potential [Z = ‑2.588; P < 0.010; Figure 3a] and body weight
vanilloid 1 (TRPV1; guinea pig antiserum diluted changes (Z = ‑3.076; P < 0.003) were significantly
rd
1:500; Neuromics, Edina, MN, USA) was performed to reduced during the 3 week after tumor cell injection
determine if CCR2 was present in nociceptors. into the femur in comparison to PBS administration.
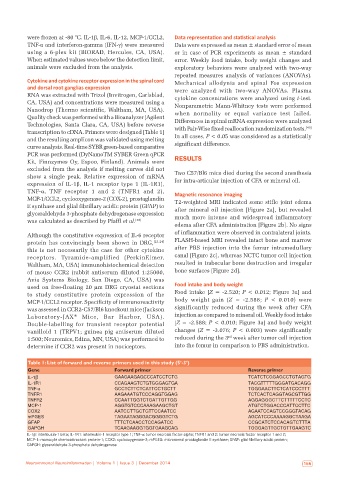
Table 1: List of forward and reverse primers used in this study (5’‑3’)
Gene Forward primer Reverse primer
IL‑1β GAAGAAGAGCCCATCCTCTG TCATCTCGGAGCCTGTAGTG
IL‑1R1 CCAGAAGTCTGTGGGAGTGA TACGTTTTTGGGATGACAGG
TNF‑ɑ GCCTCTTCTCATTCCTGCTT TGGGAACTTCTCATCCCTTT
TNFR1 AAGAAATGTCCCAGGTGGAG TCTCACTCAGGTAGCGTTGG
TNFR2 CCAATTGGTCTGATTGTTGG AGGAGGGCTTCTTTTTCCTC
MCP‑1 AGGTGTCCCAAAGAAGCTGT ATGTCTGGACCCATTCCTTC
COX2 AATCCTTGCTGTTCCAATCC AGAATCCAGTCCGGGTACAG
mPGES TAGAATAGGGACGGGGTCTG AGCATCCCAAAAGGCTAAGA
GFAP TTTCTCAACCTCCAGATCC CCGCATCTCCACAGTCTTTA
GAPGH TCAAGAAGGTGGTGAAGCAG TGGGAGTTGCTGTTGAAGTC
IL‑1β: interleukin‑1 beta; IL‑1R1: interleukin‑1 receptor type 1; TNF‑ɑ: tumor necrosis factor‑alpha; TNFR1 and 2: tumor necrosis factor receptor 1 and 2;
MCP‑1: monocyte chemoattractant protein‑1; COX2: cyclooxygenase‑2; mPGES: microsomal prostaglandin E synthase; GFAP: glial fibrillary acidic protein;
GAPGH: glyceraldehyde 3‑phosphate dehydrogenase
Neuroimmunol Neuroinflammation | Volume 1 | Issue 3 | December 2014 155