
Page 156 - Read Online
P. 156
a1 a2 a3 a4
b1 b2 b3 b4
c1 c2 c3 c4
d1 d2 d3 d4
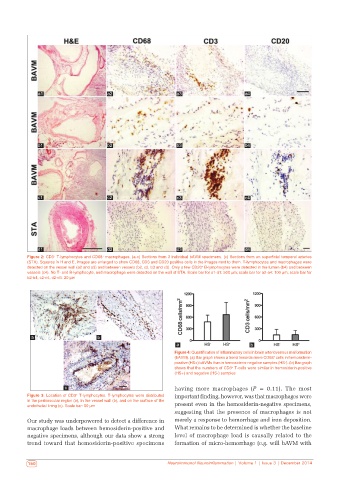
Figure 2: CD3 T‑lymphocytes and CD68 macrophages. (a‑c) Sections from 3 individual bAVM specimens. (c) Sections from an superficial temporal arteries
+
+
(STA). Squares in H and E, images are enlarged to show CD68, CD3 and CD20 positive cells in the images next to them. T‑lymphocytes and macrophages were
detected on the vessel wall (a2 and a3) and between vessels (b2, c2, b3 and c3). Only a few CD20 B‑lymphocytes were detected in the lumen (b4) and between
+
vessels (c4). No T‑ and B‑lymphocyte, and macrophage were detected on the wall of STA. Scale bar for a1‑d1: 500 μm; scale bar for a2‑a4: 100 μm; scale bar for
b2‑b4, c2‑c4, d2‑d4: 20 μm
a b
a b
Figure 4: Quantification of inflammatory cells in brain arteriovenous malformation
+
(bAVM). (a) Bar graph shows a trend towards more CD68 cells in hemosiderin‑
positive (HS+) bAVMs than in hemosiderin‑negative samples (HS‑). (b) Bar graph
shows that the numbers of CD3 T‑cells were similar in hemosiderin‑positive
+
(HS+) and negative (HS‑) samples
c having more macrophages (P = 0.11). The most
Figure 3: Location of CD3 T‑lymphocytes. T‑lymphocytes were distributed important finding, however, was that macrophages were
+
in the perivascular region (a), in the vessel wall (b), and on the surface of the
endothelial lining (c). Scale bar: 50 μm present even in the hemosiderin‑negative specimens,
suggesting that the presence of macrophages is not
Our study was underpowered to detect a difference in merely a response to hemorrhage and iron deposition.
macrophage loads between hemosiderin‑positive and What remains to be determined is whether the baseline
negative specimens, although our data show a strong level of macrophage load is causally related to the
trend toward that hemosiderin‑positive specimens formation of micro‑hemorrhage (e.g. will bAVM with
150 Neuroimmunol Neuroinflammation | Volume 1 | Issue 3 | December 2014