
Page 81 - Read Online
P. 81
Page 150 Goodman et al. J Transl Genet Genom 2020;4:144-58 I http://dx.doi.org/10.20517/jtgg.2020.23
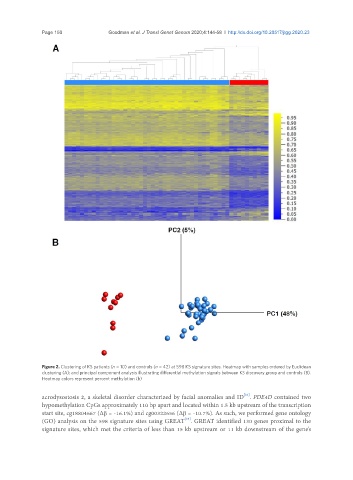
Figure 2. Clustering of KS patients (n = 10) and controls (n = 42) at 598 KS signature sites. Heatmap with samples ordered by Euclidean
clustering (A); and principal component analysis illustrating differential methylation signals between KS discovery group and controls (B).
Heatmap colors represent percent methylation (b)
[34]
acrodysostosis 2, a skeletal disorder characterized by facial anomalies and ID . PDE4D contained two
hypomethylation CpGs approximately 110 bp apart and located within 1.5 kb upstream of the transcription
start site, cg18804667 (Δb = -16.1%) and cg00322656 (Δb = -10.7%). As such, we performed gene ontology
[33]
(GO) analysis on the 598 signature sites using GREAT . GREAT identified 130 genes proximal to the
signature sites, which met the criteria of less than 15 kb upstream or 11 kb downstream of the gene’s