
Page 12 - Read Online
P. 12
Page 133 Wang et al. J Transl Genet Genom 2023;7:126-40 https://dx.doi.org/10.20517/jtgg.2023.07
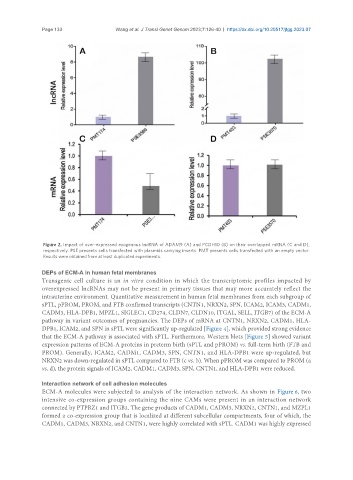
Figure 2. Impact of over-expressed exogenous lncRNA of ADAM9 (A) and PCDH10 (B) on their overlapped mRNA (C and D),
respectively. PSE presents cells transfected with plasmids carrying inserts. PMT presents cells transfected with an empty vector.
Results were obtained from at least duplicated experiments.
DEPs of ECM-A in human fetal membranes
Transgenic cell culture is an in vitro condition in which the transcriptomic profiles impacted by
overexpressed lncRNAs may not be present in primary tissues that may more accurately reflect the
intrauterine environment. Quantitative measurement in human fetal membranes from each subgroup of
sPTL, pPROM, PROM, and FTB confirmed transcripts (CNTN1, NRXN2, SPN, ICAM2, ICAM3, CADM1,
CADM3, HLA-DPB1, MPZL1, SIGLEC1, CD274, CLDN7, CLDN10, ITGAL, SELL, ITGB7) of the ECM-A
pathway in variant outcomes of pregnancies. The DEPs of mRNA at CNTN1, NRXN2, CADM1, HLA-
DPB1, ICAM2, and SPN in sPTL were significantly up-regulated [Figure 4], which provided strong evidence
that the ECM-A pathway is associated with sPTL. Furthermore, Western blots [Figure 5] showed variant
expression patterns of ECM-A proteins in preterm birth (sPTL and pPROM) vs. full-term birth (FTB and
PROM). Generally, ICAM2, CADM1, CADM3, SPN, CNTN1, and HLA-DPB1 were up-regulated, but
NRXN2 was down-regulated in sPTL compared to FTB (c vs. b). When pPROM was compared to PROM (a
vs. d), the protein signals of ICAM2, CADM1, CADM3, SPN, CNTN1, and HLA-DPB1 were reduced.
Interaction network of cell adhesion molecules
ECM-A molecules were subjected to analysis of the interaction network. As shown in Figure 6, two
intensive co-expression groups containing the nine CAMs were present in an interaction network
connected by PTPRZ1 and ITGB2. The gene products of CADM1, CADM3, NRXN2, CNTN1, and MZPL1
formed a co-expression group that is localized at different subcellular compartments, four of which, the
CADM1, CADM3, NRXN2, and CNTN1, were highly correlated with sPTL. CADM1 was highly expressed