


Page 50 - Read Online
P. 50
Li et al. J. Mater. Inf. 2025, 5, 29  https://dx.doi.org/10.20517/jmi.2024.103   Page 9 of 18

               Where y denotes true (observed) value of the dependent variable for the i-th data point. y is predicted value
                      i
                                                                                          i
               of the dependent variable for the i-th data point, as given by the learned formula or model. y represents the
                                                                                             i
               mean (average) of all the observed values y in the test set.
                                                   i
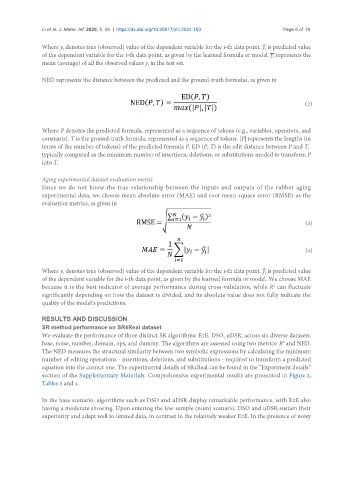
               NED represents the distance between the predicted and the ground-truth formulas, as given in


                                                                                                        (2)


               Where P denotes the predicted formula, represented as a sequence of tokens (e.g., variables, operators, and
               constants). T is the ground-truth formula, represented as a sequence of tokens. |P| represents the lengths (in
               terms of the number of tokens) of the predicted formula P. ED (P, T) is the edit distance between P and T,
               typically computed as the minimum number of insertions, deletions, or substitutions needed to transform P
               into T.


               Aging experimental dataset evaluation metric
               Since we do not know the true relationship between the inputs and outputs of the rubber aging
               experimental data, we choose mean absolute error (MAE) and root mean square error (RMSE) as the
               evaluation metrics, as given in


                                                                                                        (3)


                                                                                                        (4)


               Where y denotes true (observed) value of the dependent variable for the i-th data point. y is predicted value
                                                                                          i
                      i
               of the dependent variable for the i-th data point, as given by the learned formula or model. We choose MAE
               because it is the best indicator of average performance during cross-validation, while R  can fluctuate
                                                                                             2
               significantly depending on how the dataset is divided, and its absolute value does not fully indicate the
               quality of the model’s predictions.


               RESULTS AND DISCUSSION
               SR method performance on SR4Real dataset
               We evaluate the performance of three distinct SR algorithms: E2E, DSO, uDSR, across six diverse datasets:
               base, noise, number, domain, ops, and dummy. The algorithms are assessed using two metrics: R  and NED.
                                                                                                2
               The NED measures the structural similarity between two symbolic expressions by calculating the minimum
               number of editing operations - insertions, deletions, and substitutions - required to transform a predicted
               equation into the correct one. The experimental details of SR4Real can be found in the “Experiment details”
               section of the Supplementary Materials. Comprehensive experimental results are presented in Figure 2,
               Tables 3 and 4.

               In the base scenario, algorithms such as DSO and uDSR display remarkable performance, with E2E also
               having a moderate showing. Upon entering the few-sample (num) scenario, DSO and uDSR sustain their
               superiority and adapt well to limited data, in contrast to the relatively weaker E2E. In the presence of noisy

