


Page 54 - Read Online
P. 54
Li et al. J. Mater. Inf. 2025, 5, 29  https://dx.doi.org/10.20517/jmi.2024.103  Page 13 of 18

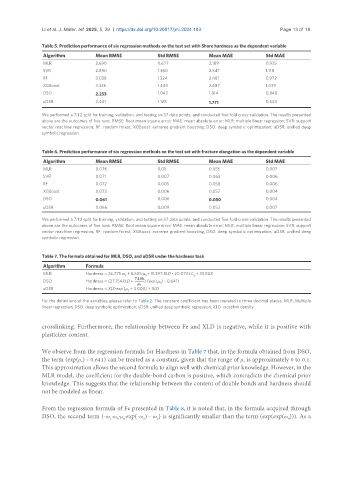
               Table 5. Prediction performance of six regression methods on the test set with Shore hardness as the dependent variable
                Algorithm        Mean RMSE            Std RMSE         Mean MAE            Std MAE
                MLR              2.690                0.677            2.189               0.935
                SVR              2.890                1.360            2.547               1.118
                RF               3.038                1.324            2.481               0.972
                XGBoost          3.326                1.449            2.687               1.039
                DSO              2.253                1.043            1.814               0.848
                uDSR             2.441                1.128            1.771               0.534

               We performed a 7:1:2 split for training, validation, and testing on 37 data points, and conducted five-fold cross-validation. The results presented
               above are the outcomes of five runs. RMSE: Root mean square error; MAE: mean absolute error; MLR: multiple linear regression; SVR: support
               vector machine regression; RF: random forest; XGBoost: extreme gradient boosting; DSO: deep symbolic optimization; uDSR: unified deep
               symbolic regression.

               Table 6. Prediction performance of six regression methods on the test set with fracture elongation as the dependent variable
                Algorithm        Mean RMSE            Std RMSE         Mean MAE            Std MAE
                MLR              0.076                0.01             0.055               0.007
                SVR              0.071                0.007            0.063               0.006
                RF               0.072                0.005            0.058               0.006
                XGBoost          0.073                0.006            0.057               0.004
                DSO              0.061                0.006            0.050               0.004
                uDSR             0.066                0.009            0.053               0.007

               We performed a 7:1:2 split for training, validation, and testing on 37 data points, and conducted five-fold cross-validation. The results presented
               above are the outcomes of five runs. RMSE: Root mean square error; MAE: mean absolute error; MLR: multiple linear regression; SVR: support
               vector machine regression; RF: random forest; XGBoost: extreme gradient boosting; DSO: deep symbolic optimization; uDSR: unified deep
               symbolic regression.

               Table 7. The formula obtained for MLR, DSO, and uDSR under the hardness task
                Algorithm     Formula
                MLR           Hardness = 26.775·ω  + 6.505·μ  + 11.397·XLD - 20.073·LC  + 33.808
                                                                  a
                                           1
                                                  3
                DSO           Hardness = (27.154XLD + 7.186) (exp (μ ) - 0.641)
                                                       3
                uDSR          Hardness = XLD·exp (μ  + 3.000) + XLD
                                            2
               For the definitions of the variables, please refer to Table 2. The constant coefficient has been rounded to three decimal places. MLR: Multiple
               linear regression; DSO: deep symbolic optimization; uDSR: unified deep symbolic regression; XLD: crosslink density.
               crosslinking. Furthermore, the relationship between Fe and XLD is negative, while it is positive with
               plasticizer content.

               We observe from the regression formula for Hardness in Table 7 that, in the formula obtained from DSO,
               the term (exp(μ ) - 0.641) can be treated as a constant, given that the range of μ  is approximately 0 to 0.1.
                                                                                   3
                            3
               This approximation allows the second formula to align well with chemical prior knowledge. However, in the
               MLR model, the coefficient for the double-bond carbon is positive, which contradicts the chemical prior
               knowledge. This suggests that the relationship between the content of double bonds and hardness should
               not be modeled as linear.

               From the regression formula of Fe presented in Table 8, it is noted that, in the formula acquired through
               DSO, the second term (-ω ·ω ·μ ·exp(-ω ) - ω ) is significantly smaller than the term (exp(exp(ω ))). As a
                                                                                                  4
                                                      2
                                      1
                                        4
                                          4
                                                 2

