


Page 54 - Read Online
P. 54
Zhu et al. J. Mater. Inf. 2025, 5, 8  https://dx.doi.org/10.20517/jmi.2024.76   Page 11 of 20


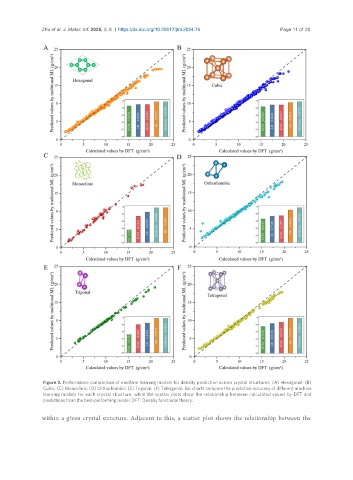
                Figure 3. Performance comparison of machine learning models for density prediction across crystal structures. (A) Hexagonal; (B)
                Cubic; (C) Monoclinic; (D) Orthorhombic; (E) Trigonal; (F) Tetragonal. Bar charts compare the predictive accuracy of different machine
                learning models for each crystal structure, while the scatter plots show the relationship between calculated values by DFT and
                predictions from the best-performing model. DFT: Density functional theory.

               within a given crystal structure. Adjacent to this, a scatter plot shows the relationship between the

