


Page 50 - Read Online
P. 50
Page 10 of 15                         Allen et al. J Mater Inf 2024;4:35  https://dx.doi.org/10.20517/jmi.2024.72


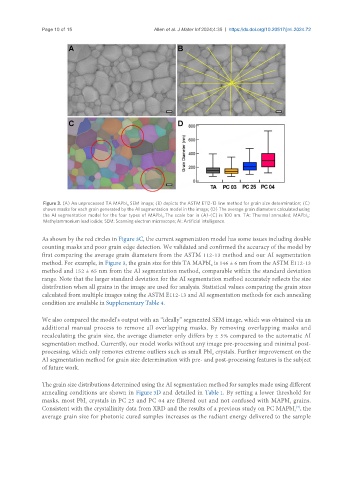
                Figure 3. (A) An unprocessed TA MAPbI  SEM image; (B) depicts the ASTM E112-13 line method for grain size determination; (C)
                                            3
                shows masks for each grain generated by the AI segmentation model in the image; (D) The average grain diameters calculated using
                the AI segmentation model for the four types of  MAPbI . The scale bar in (A)-(C) is 100 nm. TA: Thermal annealed; MAPbI :
                                                                                                         3
                                                        3
                Methylammonium lead iodide; SEM: Scanning electron microscope; AI: Artificial intelligence.
               As shown by the red circles in Figure 3C, the current segmentation model has some issues including double
               counting masks and poor grain edge detection. We validated and confirmed the accuracy of the model by
               first comparing the average grain diameters from the ASTM 112-13 method and our AI segmentation
               method. For example, in Figure 3, the grain size for this TA MAPbI  is 146 ± 6 nm from the ASTM E112-13
                                                                        3
               method and 152 ± 65 nm from the AI segmentation method, comparable within the standard deviation
               range. Note that the larger standard deviation for the AI segmentation method accurately reflects the size
               distribution when all grains in the image are used for analysis. Statistical values comparing the grain sizes
               calculated from multiple images using the ASTM E112-13 and AI segmentation methods for each annealing
               condition are available in Supplementary Table 4.

               We also compared the model’s output with an “ideally” segmented SEM image, which was obtained via an
               additional manual process to remove all overlapping masks. By removing overlapping masks and
               recalculating the grain size, the average diameter only differs by ± 5% compared to the automatic AI
               segmentation method. Currently, our model works without any image pre-processing and minimal post-
               processing, which only removes extreme outliers such as small PbI  crystals. Further improvement on the
                                                                         2
               AI segmentation method for grain size determination with pre- and post-processing features is the subject
               of future work.


               The grain size distributions determined using the AI segmentation method for samples made using different
               annealing conditions are shown in Figure 3D and detailed in Table 1. By setting a lower threshold for
               masks, most PbI  crystals in PC 25 and PC 04 are filtered out and not confused with MAPbI  grains.
                                                                                                   3
                              2
                                                                                                     [7]
               Consistent with the crystallinity data from XRD and the results of a previous study on PC MAPbI , the
                                                                                                    3
               average grain size for photonic cured samples increases as the radiant energy delivered to the sample

