
Page 99 - Read Online
P. 99
Page 22 of 37 Ye et al. J Mater Inf 2023;3:15 https://dx.doi.org/10.20517/jmi.2023.08
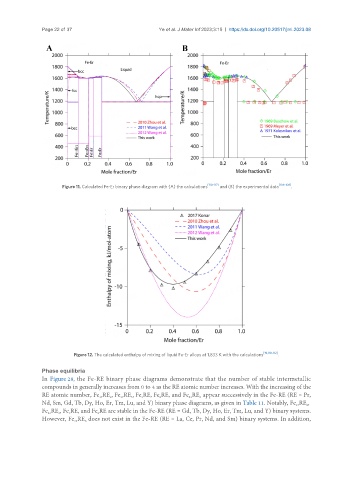
Figure 11. Calculated Fe-Er binary phase diagram with (A) the calculations [110-112] and (B) the experimental data [106-108] .
Figure 12. The calculated enthalpy of mixing of liquid Fe-Er alloys at 1,833 K with the calculations [19,110-112] .
Phase equilibria
In Figure 28, the Fe-RE binary phase diagrams demonstrate that the number of stable intermetallic
compounds in generally increases from 0 to 4 as the RE atomic number increases. With the increasing of the
RE atomic number, Fe RE , Fe RE , Fe RE, Fe RE, and Fe RE appear successively in the Fe-RE (RE = Pr,
5
17
2
17
23
6
3
2
Nd, Sm, Gd, Tb, Dy, Ho, Er, Tm, Lu, and Y) binary phase diagrams, as given in Table 11. Notably, Fe RE ,
2
17
Fe RE , Fe RE, and Fe RE are stable in the Fe-RE (RE = Gd, Tb, Dy, Ho, Er, Tm, Lu, and Y) binary systems.
23
6
2
3
However, Fe RE does not exist in the Fe-RE (RE = La, Ce, Pr, Nd, and Sm) binary systems. In addition,
23
6