
Page 97 - Read Online
P. 97
Page 20 of 37 Ye et al. J Mater Inf 2023;3:15 https://dx.doi.org/10.20517/jmi.2023.08
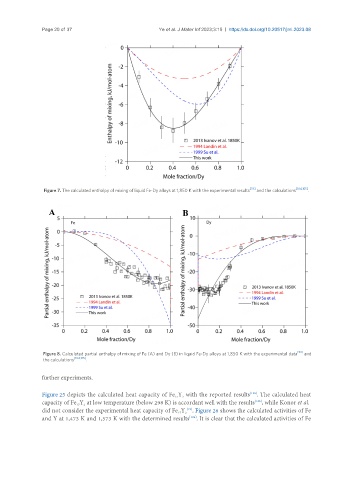
Figure 7. The calculated enthalpy of mixing of liquid Fe-Dy alloys at 1,850 K with the experimental results [53] and the calculations [104,105] .
Figure 8. Calculated partial enthalpy of mixing of Fe (A) and Dy (B) in liquid Fe-Dy alloys at 1,850 K with the experimental data [53] and
the calculations [104,105] .
further experiments.
Figure 25 depicts the calculated heat capacity of Fe Y with the reported results . The calculated heat
[125]
17 2
[125]
capacity of Fe Y at low temperature (below 298 K) is accordant well with the results , while Konor et al.
17 2
did not consider the experimental heat capacity of Fe Y . Figure 26 shows the calculated activities of Fe
[19]
17 2
and Y at 1,473 K and 1,573 K with the determined results . It is clear that the calculated activities of Fe
[126]