
Page 93 - Read Online
P. 93
Page 16 of 37 Ye et al. J Mater Inf 2023;3:15 https://dx.doi.org/10.20517/jmi.2023.08
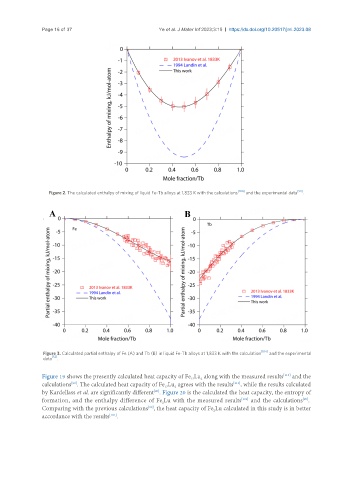
Figure 2. The calculated enthalpy of mixing of liquid Fe-Tb alloys at 1,833 K with the calculations [104] and the experimental data [53] .
[104]
Figure 3. Calculated partial enthalpy of Fe (A) and Tb (B) in liquid Fe-Tb alloys at 1,833 K with the calculation and the experimental
data [53] .
Figure 19 shows the presently calculated heat capacity of Fe Lu along with the measured results and the
[113]
2
17
calculations . The calculated heat capacity of Fe Lu agrees with the results , while the results calculated
[113]
[90]
17
2
[90]
by Kardellass et al. are significantly different . Figure 20 is the calculated the heat capacity, the entropy of
formation, and the enthalpy difference of Fe Lu with the measured results and the calculations .
[90]
[101]
2
Comparing with the previous calculations , the heat capacity of Fe Lu calculated in this study is in better
[90]
2
accordance with the results .
[101]