
Page 29 - Read Online
P. 29
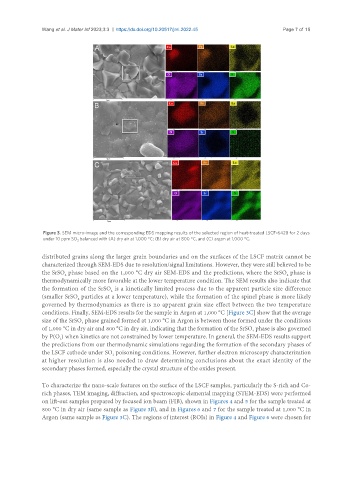
Wang et al. J Mater Inf 2023;3:3  https://dx.doi.org/10.20517/jmi.2022.45        Page 7 of 15


                Figure 3. SEM micro-image and the corresponding EDS mapping results of the selected region of heat-treated LSCF-6428 for 2 days
                under 10 ppm SO  balanced with (A) dry air at 1,000 °C; (B) dry air at 800 °C, and (C) argon at 1,000 °C.
                           2
               distributed grains along the larger grain boundaries and on the surfaces of the LSCF matrix cannot be
               characterized through SEM-EDS due to resolution/signal limitations. However, they were still believed to be
               the SrSO  phase based on the 1,000 °C dry air SEM-EDS and the predictions, where the SrSO  phase is
                                                                                                  4
                       4
               thermodynamically more favorable at the lower temperature condition. The SEM results also indicate that
               the formation of the SrSO  is a kinetically limited process due to the apparent particle size difference
                                      4
               (smaller SrSO  particles at a lower temperature), while the formation of the spinel phase is more likely
                           4
               governed by thermodynamics as there is no apparent grain size effect between the two temperature
               conditions. Finally, SEM-EDS results for the sample in Argon at 1,000 °C [Figure 3C] show that the average
               size of the SrSO  phase grained formed at 1,000 °C in Argon is between those formed under the conditions
                             4
               of 1,000 °C in dry air and 800 °C in dry air, indicating that the formation of the SrSO  phase is also governed
                                                                                      4
               by P(O ) when kinetics are not constrained by lower temperature. In general, the SEM-EDS results support
                     2
               the predictions from our thermodynamic simulations regarding the formation of the secondary phases of
               the LSCF cathode under SO  poisoning conditions. However, further electron microscopy characterization
                                       2
               at higher resolution is also needed to draw determining conclusions about the exact identity of the
               secondary phases formed, especially the crystal structure of the oxides present.

               To characterize the nano-scale features on the surface of the LSCF samples, particularly the S-rich and Co-
               rich phases, TEM imaging, diffraction, and spectroscopic elemental mapping (STEM-EDS) were performed
               on lift-out samples prepared by focused ion beam (FIB), shown in Figures 4 and 5 for the sample treated at
               800 °C in dry air (same sample as Figure 3B), and in Figures 6 and 7 for the sample treated at 1,000 °C in
               Argon (same sample as Figure 3C). The regions of interest (ROIs) in Figure 4 and Figure 6 were chosen for