
Page 32 - Read Online
P. 32
Page 10 of 15 Wang et al. J Mater Inf 2023;3:3 https://dx.doi.org/10.20517/jmi.2022.45
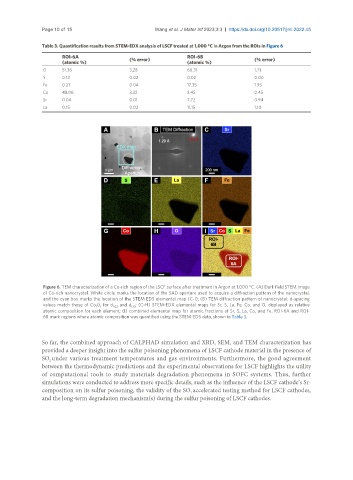
Table 3. Quantification results from STEM-EDX analysis of LSCF treated at 1,000 °C in Argon from the ROIs in Figure 6
ROI-6A (% error) ROI-6B (% error)
(atomic %) (atomic %)
O 51.36 3.28 60.31 1.71
S 0.12 0.02 0.02 0.00
Fe 0.27 0.04 17.35 1.93
Co 48.06 3.32 3.45 0.45
Sr 0.04 0.01 7.72 0.94
La 0.15 0.02 11.15 1.10
Figure 6. TEM characterization of a Co-rich region of the LSCF surface after treatment in Argon at 1,000 °C. (A) Dark field STEM image
of Co-rich nanocrystal. White circle marks the location of the SAD aperture used to acquire a diffraction pattern of the nanocrystal,
and the cyan box marks the location of the STEM EDS elemental map (C-I); (B) TEM diffraction pattern of nanocrystal; d-spacing
values match those of Co O for d 022 and d ; (C-H) STEM-EDX elemental maps for Sr, S, La, Fe, Co, and O, displayed as relative
1
133
1
atomic composition for each element; (I) combined elemental map for atomic fractions of Sr, S, La, Co, and Fe. ROI-6A and ROI-
6B mark regions where atomic composition was quantified using the STEM-EDS data, shown in Table 3.
So far, the combined approach of CALPHAD simulation and XRD, SEM, and TEM characterization has
provided a deeper insight into the sulfur poisoning phenomena of LSCF cathode material in the presence of
SO under various treatment temperatures and gas environments. Furthermore, the good agreement
2
between the thermodynamic predictions and the experimental observations for LSCF highlights the utility
of computational tools to study materials degradation phenomena in SOFC systems. Thus, further
simulations were conducted to address more specific details, such as the influence of the LSCF cathode’s Sr-
composition on its sulfur poisoning, the validity of the SO accelerated testing method for LSCF cathodes,
2
and the long-term degradation mechanism(s) during the sulfur poisoning of LSCF cathodes.