
Page 33 - Read Online
P. 33
Wang et al. J Mater Inf 2023;3:3 https://dx.doi.org/10.20517/jmi.2022.45 Page 11 of 15
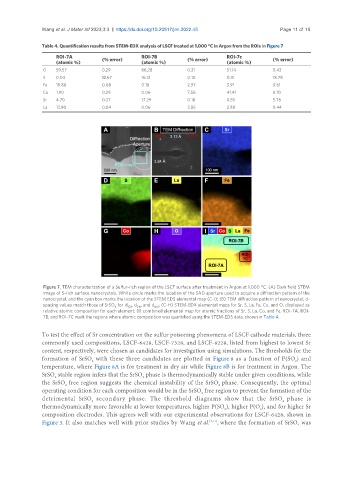
Table 4. Quantification results from STEM-EDX analysis of LSCF treated at 1,000 °C in Argon from the ROIs in Figure 7
ROI-7A (% error) ROI-7B (% error) ROI-7c (% error)
(atomic %) (atomic %) (atomic %)
O 59.57 0.29 66.28 0.21 51.14 0.43
S 0.04 12.67 16.13 0.10 0.11 18.78
Fe 19.88 0.08 0.18 2.97 3.91 0.61
Co 1.90 0.29 0.06 7.56 41.41 0.10
Sr 4.70 0.37 17.29 0.18 0.55 5.78
La 13.90 0.04 0.06 3.85 2.88 0.44
Figure 7. TEM characterization of a Sulfur-rich region of the LSCF surface after treatment in Argon at 1,000 °C. (A) Dark field STEM
image of S-rich surface nanocrystals. White circle marks the location of the SAD aperture used to acquire a diffraction pattern of the
nanocrystal, and the cyan box marks the location of the STEM EDS elemental map (C-I); (B) TEM diffraction pattern of nanocrystal; d-
spacing values match those of SrSO for d , d , and d ; (C-H) STEM-EDX elemental maps for Sr, S, La, Fe, Co, and O, displayed as
4
401
210
102
relative atomic composition for each element; (I) combined elemental map for atomic fractions of Sr, S, La, Co, and Fe. ROI-7A, ROI-
7B, and ROI-7C mark the regions where atomic composition was quantified using the STEM-EDS data, shown in Table 4.
To test the effect of Sr concentration on the sulfur poisoning phenomena of LSCF cathode materials, three
commonly used compositions, LSCF-6428, LSCF-7328, and LSCF-8228, listed from highest to lowest Sr
content, respectively, were chosen as candidates for investigation using simulations. The thresholds for the
formation of SrSO with these three candidates are plotted in Figure 8 as a function of P(SO ) and
2
4
temperature, where Figure 8A is for treatment in dry air while Figure 8B is for treatment in Argon. The
SrSO stable region infers that the SrSO phase is thermodynamically stable under given conditions, while
4
4
the SrSO free region suggests the chemical instability of the SrSO phase. Consequently, the optimal
4
4
operating condition for each composition would be in the SrSO free region to prevent the formation of the
4
detrimental SrSO secondary phase. The threshold diagrams show that the SrSO phase is
4
4
thermodynamically more favorable at lower temperatures, higher P(SO ), higher P(O ), and for higher Sr
2
2
composition electrodes. This agrees well with our experimental observations for LSCF-6428, shown in
Figure 3. It also matches well with prior studies by Wang et al. [7,11] , where the formation of SrSO was
4