
Page 31 - Read Online
P. 31
Wang et al. J Mater Inf 2023;3:3 https://dx.doi.org/10.20517/jmi.2022.45 Page 9 of 15
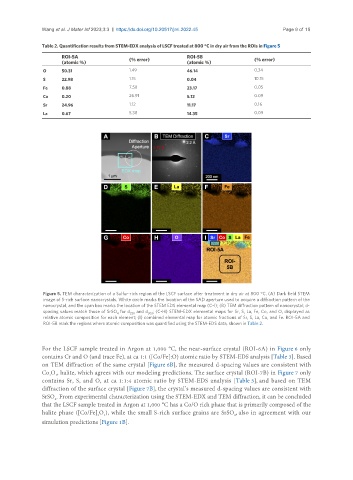
Table 2. Quantification results from STEM-EDX analysis of LSCF treated at 800 °C in dry air from the ROIs in Figure 5
ROI-5A (% error) ROI-5B (% error)
(atomic %) (atomic %)
O 50.31 1.49 46.14 0.34
S 22.98 1.15 0.04 10.15
Fe 0.88 7.58 23.17 0.05
Co 0.20 26.91 5.12 0.09
Sr 24.96 1.12 11.17 0.16
La 0.67 5.38 14.35 0.09
Figure 5. TEM characterization of a Sulfur-rich region of the LSCF surface after treatment in dry air at 800 °C. (A) Dark field STEM
image of S-rich surface nanocrystals. White circle marks the location of the SAD aperture used to acquire a diffraction pattern of the
nanocrystal, and the cyan box marks the location of the STEM EDS elemental map (C-I); (B) TEM diffraction pattern of nanocrystal; d-
spacing values match those of SrSO for d 220 and d 303 ; (C-H) STEM-EDX elemental maps for Sr, S, La, Fe, Co, and O, displayed as
4
relative atomic composition for each element; (I) combined elemental map for atomic fractions of Sr, S, La, Co, and Fe. ROI-5A and
ROI-5B mark the regions where atomic composition was quantified using the STEM-EDS data, shown in Table 2.
For the LSCF sample treated in Argon at 1,000 °C, the near-surface crystal (ROI-6A) in Figure 6 only
contains Cr and O (and trace Fe), at ca 1:1 ([Co/Fe]:O) atomic ratio by STEM-EDS analysis [Table 3]. Based
on TEM diffraction of the same crystal [Figure 6B], the measured d-spacing values are consistent with
Co O , halite, which agrees with our modeling predictions. The surface crystal (ROI-7B) in Figure 7 only
1
1
contains Sr, S, and O, at ca 1:1:4 atomic ratio by STEM-EDS analysis [Table 3], and based on TEM
diffraction of the surface crystal [Figure 7B], the crystal’s measured d-spacing values are consistent with
SrSO . From experimental characterization using the STEM-EDX and TEM diffraction, it can be concluded
4
that the LSCF sample treated in Argon at 1,000 °C has a Co/O rich phase that is primarily composed of the
halite phase ([Co/Fe] O ), while the small S-rich surface grains are SrSO , also in agreement with our
1
4
1
simulation predictions [Figure 1B].