
Page 78 - Read Online
P. 78
Page 10 of 18 Monaco et al. J Environ Expo Assess 2024;3:18 https://dx.doi.org/10.20517/jeea.2024.10
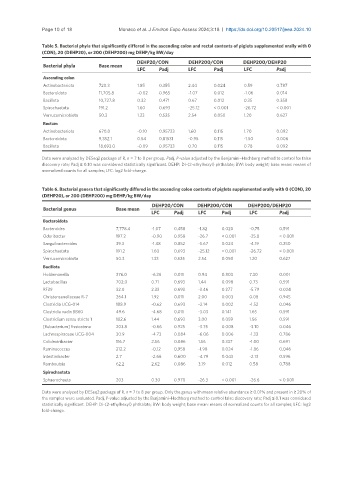
Table 5. Bacterial phyla that significantly differed in the ascending colon and rectal contents of piglets supplemented orally with 0
(CON), 20 (DEHP20), or 200 (DEHP200) mg DEHP/kg BW/day
DEHP20/CON DEHP200/CON DEHP200/DEHP20
Bacterial phyla Base mean
LFC Padj LFC Padj LFC Padj
Ascending colon
Actinobacteriota 720.3 1.85 0.355 2.44 0.024 0.59 0.787
Bacteroidota 11,705.8 -0.02 0.965 -1.07 0.012 -1.06 0.014
Bacillota 10,727.8 0.32 0.471 0.67 0.012 0.35 0.358
Spirochaetota 191.2 1.60 0.693 -25.12 < 0.001 -26.72 < 0.001
Verrucomicrobiota 50.3 1.33 0.525 2.54 0.050 1.20 0.627
Rectum
Actinobacteriota 670.0 -0.10 0.95733 1.60 0.115 1.70 0.092
Bacteroidota 9,352.1 0.54 0.81531 -0.95 0.115 -1.50 0.006
Bacillota 18,693.0 -0.09 0.95733 0.70 0.115 0.78 0.092
Data were analyzed by DESeq2 package of R, n = 7 to 8 per group. Padj, P-value adjusted by the Benjamini–Hochberg method to control for false
discovery rate; Padj ≤ 0.10 was considered statistically significant. DEHP: Di-(2-ethylhexyl) phthalate; BW: body weight; base mean: means of
normalized counts for all samples; LFC: log2 fold-change.
Table 6. Bacterial genera that significantly differed in the ascending colon contents of piglets supplemented orally with 0 (CON), 20
(DEHP20), or 200 (DEHP200) mg DEHP/kg BW/day
DEHP20/CON DEHP200/CON DEHP200/DEHP20
Bacterial genus Base mean
LFC Padj LFC Padj LFC Padj
Bacteroidota
Bacteroides 7,778.4 -1.07 0.458 -1.82 0.020 -0.75 0.591
Odoribacter 197.2 -0.90 0.958 -26.7 < 0.001 -25.8 < 0.001
Sanguibacteroides 39.3 -1.48 0.852 -5.67 0.024 -4.19 0.250
Spirochaetota 191.2 1.60 0.693 -25.12 < 0.001 -26.72 < 0.001
Verrucomicrobiota 50.3 1.33 0.525 2.54 0.050 1.20 0.627
Bacillota
Holdemanella 376.0 -6.36 0.011 0.94 0.803 7.30 0.001
Lactobacillus 702.0 0.71 0.693 1.44 0.098 0.73 0.591
RF39 32.0 2.33 0.693 -3.46 0.277 -5.79 0.024
Christensenellaceae R-7 264.1 1.92 0.011 2.00 0.003 0.08 0.945
Clostridia UCG-014 188.9 -0.62 0.693 -2.14 0.002 -1.52 0.046
Clostridia vadin BB60 49.6 -4.68 0.011 -3.03 0.141 1.65 0.591
Clostridium sensu stricto 1 102.6 1.44 0.693 3.00 0.059 1.56 0.591
[Eubacterium] fissicatena 203.8 -0.66 0.925 -3.75 0.008 -3.10 0.046
Lachnospiraceae UCG-004 30.9 -4.73 0.084 -6.06 0.006 -1.33 0.786
Colidextribacter 116.7 2.56 0.086 1.56 0.337 -1.00 0.691
Ruminococcus 212.2 -0.12 0.958 -1.98 0.024 -1.86 0.046
Intestinibacter 2.7 -2.66 0.600 -4.79 0.043 -2.13 0.596
Romboutsia 62.2 2.62 0.086 3.19 0.012 0.58 0.788
Spirochaetota
Sphaerochaeta 203 0.30 0.970 -26.3 < 0.001 -26.6 < 0.001
Data were analyzed by DESeq2 package of R, n = 7 to 8 per group. Only the genus with mean relative abundance ≥ 0.01% and present in ≥ 20% of
the samples were evaluated. Padj, P-value adjusted by the Benjamini–Hochberg method to control false discovery rate; Padj ≤ 0.1 was considered
statistically significant. DEHP: Di-(2-ethylhexyl) phthalate; BW: body weight; base mean: means of normalized counts for all samples; LFC: log2
fold-change.