
Page 77 - Read Online
P. 77
Monaco et al. J Environ Expo Assess 2024;3:18 https://dx.doi.org/10.20517/jeea.2024.10 Page 9 of 18
Table 4. Alpha diversity measures of ascending colon and rectal contents of piglets supplemented orally with 0 (CON), 20
(DEHP20), or 200 (DEHP200) mg DEHP/kg BW/day
Treatment groups
CON DEHP20 DEHP200 P-value
Ascending colon
a b b
Observed features 365 ± 24.8 451 ± 21.8 448 ± 18.2 0.012
Evenness 0.7 ± 0.01 0.73 ± 0.01 0.74 ± 0.01 0.073
Shannon index 5.9 ± 0.17 a 6.4 ± 0.09 b 6.5 ± 0.14 b 0.0117
Faith’s PD 16.3 ± 0.55 17.6 ± 0.58 17.1 ± 0.4 0.19
Rectum
Observed features 392 ± 18.5 421 ± 23 462 ± 22.9 0.069
Evenness 0.74 ± 0.02 0.74 ± 0.01 0.73 ± 0.01 0.99
Shannon index 6.4 ± 0.23 6.4 ± 0.14 6.5 ± 0.16 0.83
Faith’s PD 17.9 ± 0.51 18.7 ± 0.75 18.5 ± 0.58 0.64
Data are expressed as mean ± SEM. Different letters superscripts in a row indicate differences at P < 0.05. n = 7 to 8 per group. DEHP: Di-(2-
ethylhexyl) phthalate; BW: body weight; PD: phylogenetic diversity; SEM: standard error of the means.
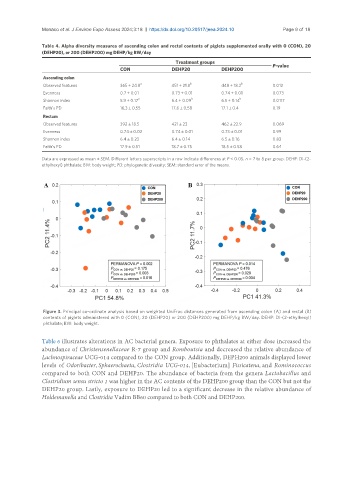
Figure 3. Principal co-ordinate analysis based on weighted UniFrac distances generated from ascending colon (A) and rectal (B)
contents of piglets administered with 0 (CON), 20 (DEHP20) or 200 (DEHP200) mg DEHP/kg BW/day. DEHP: Di-(2-ethylhexyl)
phthalate; BW: body weight.
Table 6 illustrates alterations in AC bacterial genera. Exposure to phthalates at either dose increased the
abundance of Christensenellaceae R-7 group and Romboutsia and decreased the relative abundance of
Lachnospiraceae UCG-014 compared to the CON group. Additionally, DEPH200 animals displayed lower
levels of Odoribacter, Sphaerochaeta, Clostridia UCG-014, [Eubacterium] Fissicatena, and Rominococcus
compared to both CON and DEHP20. The abundance of bacteria from the genera Lactobacillus and
Clostridium sensu stricto 1 was higher in the AC contents of the DEHP200 group than the CON but not the
DEHP20 group. Lastly, exposure to DEHP20 led to a significant decrease in the relative abundance of
Holdemanella and Clostridia Vadim BB60 compared to both CON and DEHP200.