Page 64 - Read Online
P. 64

Rawn et al. J Environ Expo Assess 2024;3:16  https://dx.doi.org/10.20517/jeea.2024.04  Page 13 of 17

                                                 -1
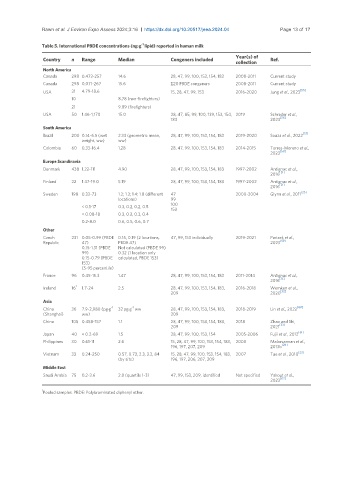
               Table 5. International PBDE concentrations (ng·g  lipid) reported in human milk
                                                                                 Year(s) of
                Country  n   Range       Median            Congeners included               Ref.
                                                                                 collection
                North America
                Canada   298 0.473-257   14.6              28, 47, 99, 100, 153, 154, 183  2008-2011  Current study
                Canada   298 0.071-267   15.6              Σ20 PBDE congeners    2008-2011  Current study
                USA      31  4.79-18.6                     15, 28, 47, 99, 153   2016-2020  Jung et al., 2023 [55]
                         10              8.78 (non-firefighters)
                         21              9.89 (firefighters)
                USA      50  1.46-1,170  15.0              28, 47, 85, 99, 100, 139, 153, 154,  2019  Schreder et al.,
                                                           183                              2023 [56]
                South America
                                                                                                       [57]
                Brazil   200 0.14-6.5 (wet   2.33 (geometric mean,   28, 47, 99, 100, 153, 154, 183  2019-2020  Souza et al., 2022
                             weight, ww)  ww)
                Colombia  60  0.33-16.4  1.28              28, 47, 99, 100, 153, 154, 183  2014-2015  Torres-Moreno et al.,
                                                                                               [58]
                                                                                            2023
                Europe Scandinavia
                Denmark  438 1.22-111    4.90              28, 47, 99, 100, 153, 154, 183  1997-2002  Antignac et al.,
                                                                                            2016 [31]
                Finland  22  1.47-19.0   5.19              28, 47, 99, 100, 153, 154, 183  1997-2002  Antignac et al.,
                                                                                            2016 [31]
                                                                                                      [25]
                Sweden   198  0.33-73    1.2; 1.3; 1.4; 1.8 (different   47      2000-2004  Glynn et al., 2011
                                         locations)        99
                                                           100
                             < 0.1-17    0.3, 0.2, 0.2, 0.5
                                                           153
                             < 0.08-18   0.3, 0.2, 0.3, 0.4
                             0.2-8.0     0.6, 0.5, 0.6, 0.7
                Other
                Czech    231 0.05-0.99 (PBDE  0.15, 0.19 (2 locations,   47, 99, 153 individually  2019-2021  Parizek et al.,
                Republic     47)         PBDE 47)                                           2023 [59]
                             0.15-1.31 (PBDE   Not calculated (PBDE 99)
                             99)         0.32 (1 location only
                             0.15-0.79 (PBDE   calculated, PBDE 153)
                             153)
                             (5-95 percentile)
                France   96  0.45-15.3   1.47              28, 47, 99, 100, 153, 154, 183  2011-2014  Antignac et al.,
                                                                                            2016 [31]
                           1
                Ireland  16  1.7-24      2.5               28, 47, 99, 100, 153, 154, 183,   2016-2018  Wemken et al.,
                                                           209                              2020 [32]
                Asia
                                      -1
                                             -1
                China    36  7.9-2,980 (pg·g   32 pg·g  ww  28, 47, 99, 100, 153, 154, 183,   2018-2019  Lin et al., 2022 [60]
                (Shanghai)   ww)                           209
                China    105 0.458-157   1.1               28, 47, 99, 100, 153, 154, 183,   2018  Zhao and Shi,
                                                                                               [33]
                                                           209                              2021
                Japan    40  < 0.2-69    1.5               28, 47, 99, 100, 153, 154  2005-2006  Fujii et al., 2012 [61]
                Philippines  30  0.61-11  2.6              15, 28, 47, 99, 100, 153, 154, 183,  2008  Malarvannan et al.,
                                                                                                [26]
                                                           196, 197, 207, 209               2013b
                                                                                                      [23]
                Vietnam  33  0.24-250    0.57, 0.73, 2.3, 3.2, 84   15, 28, 47, 99, 100, 153, 154, 183,  2007  Tue et al., 2010
                                         (by site)         196, 197, 206, 207, 209
                Middle East
                Saudi Arabia  75  0.2-3.6  2.8 (quartile 1-3)  47, 99, 153, 209, identified  Not specified  Yakout et al.,
                                                                                               [62]
                                                                                            2023
               1
                Pooled samples. PBDE: Polybrominated diphenyl ether.
   59   60   61   62   63   64   65   66   67   68   69