
Page 32 - Read Online
P. 32
Greene et al. J Environ Expo Assess 2024;3:12 https://dx.doi.org/10.20517/jeea.2024.09 Page 9 of 15
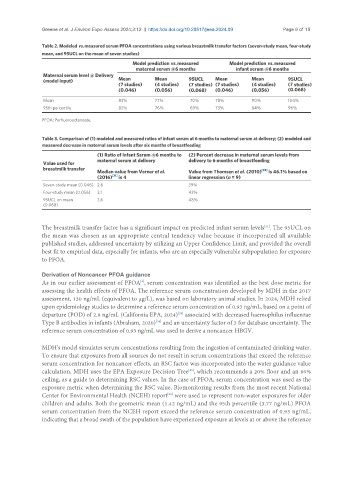
Table 2. Modeled vs. measured serum PFOA concentrations using various breastmilk transfer factors (seven-study mean, four-study
mean, and 95UCL on the mean of seven studies)
Model prediction vs. measured Model prediction vs. measured
maternal serum @6 months infant serum @6 months
Maternal serum level @ Delivery
(model input) Mean Mean 95UCL Mean Mean 95UCL
(7 studies) (4 studies) (7 studies) (7 studies) (4 studies) (7 studies)
(0.046) (0.056) (0.068) (0.046) (0.056) (0.068)
Mean 83% 77% 70% 78% 90% 104%
95th percentile 82% 76% 69% 73% 84% 96%
PFOA: Perfluorooctanoate.
Table 3. Comparison of (1) modeled and measured ratios of infant serum at 6 months to maternal serum at delivery; (2) modeled and
measured decrease in maternal serum levels after six months of breastfeeding
(1) Ratio of Infant Serum @6 months to (2) Percent decrease in maternal serum levels from
maternal serum at delivery delivery to 6 months of breastfeeding
Value used for
breastmilk transfer [33]
Median value from Verner et al. Value from Thomsen et al. (2010) is 46.1% based on
(2016) [31] is 4 linear regression (n = 9)
Seven-study mean (0.046) 2.6 39%
Four-study mean (0.056) 3.1 43%
95UCL on mean 3.6 48%
(0.068)
[31]
The breastmilk transfer factor has a significant impact on predicted infant serum levels . The 95UCL on
the mean was chosen as an appropriate central tendency value because it incorporated all available
published studies, addressed uncertainty by utilizing an Upper Confidence Limit, and provided the overall
best fit to empirical data, especially for infants, who are an especially vulnerable subpopulation for exposure
to PFOA.
Derivation of Noncancer PFOA guidance
As in our earlier assessment of PFOA , serum concentration was identified as the best dose metric for
[9]
assessing the health effects of PFOA. The reference serum concentration developed by MDH in the 2017
assessment, 130 ng/mL (equivalent to µg/L), was based on laboratory animal studies. In 2024, MDH relied
upon epidemiology studies to determine a reference serum concentration of 0.93 ng/mL, based on a point of
departure (POD) of 2.8 ng/mL (California EPA, 2024) associated with decreased haemophilus influenzae
[29]
[34]
Type B antibodies in infants (Abraham, 2020) and an uncertainty factor of 3 for database uncertainty. The
reference serum concentration of 0.93 ng/mL was used to derive a noncancer HBGV.
MDH’s model simulates serum concentrations resulting from the ingestion of contaminated drinking water.
To ensure that exposures from all sources do not result in serum concentrations that exceed the reference
serum concentration for noncancer effects, an RSC factor was incorporated into the water guidance value
calculation. MDH uses the EPA Exposure Decision Tree , which recommends a 20% floor and an 80%
[35]
ceiling, as a guide to determining RSC values. In the case of PFOA, serum concentration was used as the
exposure metric when determining the RSC value. Biomonitoring results from the most recent National
[36]
Center for Environmental Health (NCEH) report were used to represent non-water exposures for older
children and adults. Both the geometric mean (1.42 ng/mL) and the 95th percentile (3.77 ng/mL) PFOA
serum concentration from the NCEH report exceed the reference serum concentration of 0.93 ng/mL,
indicating that a broad swath of the population have experienced exposure at levels at or above the reference