
Page 28 - Read Online
P. 28
Greene et al. J Environ Expo Assess 2024;3:12 https://dx.doi.org/10.20517/jeea.2024.09 Page 5 of 15
Body weight (kg) (breastfed infant) Age:Value Age:Value Derived from intakes in EPA EFH, 2011 [19] . [no change from 2017]
< 1 month: 4.3 < 1 month: 4.3 Body weight was calculated by dividing breastmilk intake (mL/day) by weight-normalized intake
1 to 3 month: 5.2 1 to 3 month: 5.2 (mL/kg/day)
3 to 6 month: 6.7 3 to 6 month: 6.7
6 to 12 month: 7.7 6 to 12 month: 7.7
Half-life (t ) (days) 840 902 Central tendency value from Li et al. (2022) [21]
½
Placental (infant:maternal) transfer 0.87 0.83 Central tendency value; mean of 25 studies [Supplementary Table 1]
Breastmilk (milk:maternal) transfer 0.052 0.068 95% Upper Confidence Limit on the mean of 7 studies [Supplementary Table 2]. Mean value was 0.046
Volume of Distribution (V ) 0.17 0.36 Calculated from clearance rate and half-life; see text
d
V adjustment factors Age:Value N/A V adjustment factors were not used in the 2024 evaluation; see text
d d
0 to 1 day: 2.4
1 to 30 days: 2.1
1 to < 3 month: 1.7
3 to < 6 month: 1.6
6 to < 12 month: 1.5
1 to < 3 year: 1.4
3 to < 5 year: 1.1
5 to < 10 year: 1.2
> 10 year: 1.0
Chemical-specific values are indicated in bold. RME: Reasonable Maximum Exposure; EPA: Environmental Protection Agency; EFH: Exposure Factors Handbook; N/A: not applicable.
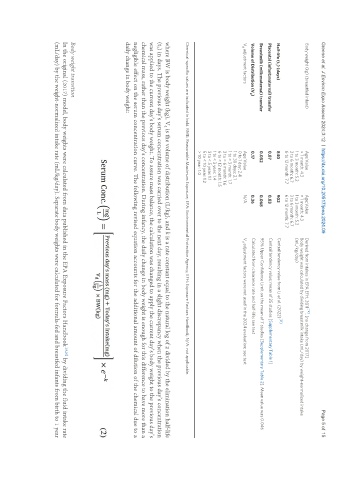
where BW is body weight (kg), V is the volume of distribution (L/kg), and k is a rate constant equal to the natural log of 2 divided by the elimination half-life
d
(t ) in days. The previous day’s serum concentration was carried over to the next day, resulting in a slight discrepancy when the previous day’s concentration
½
was applied to the current day’s body weight. To assure mass balance, the calculation was changed to apply the current day’s body weight to the previous day’s
chemical mass, rather than the previous day’s concentration. During infancy, the daily change in body weight is enough for this difference to have more than a
negligible effect on the serum concentration curve. The following revised equation accounts for the additional amount of dilution of the chemical due to a
daily change in body weight:
Body weight transition
In the original (2017) model, body weights were calculated from data published in the EPA Exposure Factors Handbook [19,20] by dividing the fluid intake rate
(mL/day) by the weight-normalized intake rate (mL/kg/day). Separate body weights were calculated for formula-fed and breastfed infants from birth to 1 year