
Page 34 - Read Online
P. 34
Greene et al. J Environ Expo Assess 2024;3:12 https://dx.doi.org/10.20517/jeea.2024.09 Page 11 of 15
Table 4. Changes in modeled peak serum concentration for breastfed infants attributable to non-chemical-related model updates
and improvements
Peak serum concentration* relative to baseline
Model update
(ng/mL)
2017 Model (baseline) 0.438 (n/a)
Mass-based calculation 0.342 (-22%)
Mass-based and maternal loss to newborn 0.313 (-28%)
Milk Intake smoothing and phase-in 0.439 (+0.38%)
Milk Intake smoothing alone 0.441 (+0.62%)
Milk Intake phase-in alone 0.437 (-0.24%)
Body weight and water intake rate updates (including BW transition for breastfed 0.438 (+0.056%)
infants at 1 year old)
All “non-chemical-specific” updates combined 0.318 (-27%)
*Using a drinking water concentration of 0.24 ng/L.
Table 5. Changes in modeled peak serum concentration for breastfed infants attributable to chemical parameter changes
Model parameter update Peak serum concentration* relative to baseline, ng/mL
Revised model with 2017 chemical parameters (baseline) 0.318 [Table 4]
Half-life 0.344 (+8%)
V and V AF 0.148 (-54%)
d
d
Infant:maternal serum ratio 0.318 (-0.10%)
Milk:maternal serum ratio 0.353 (+11%)
All updates combined 0.187 (-41%)**
*Using a drinking water concentration of 0.24 ng/L; **-41% is the reduction attributable to changes in chemical parameter values. The overall
change relative to the 2017 baseline value of 0.438 ng/mL using the 2017 model [Table 4] is -57%.
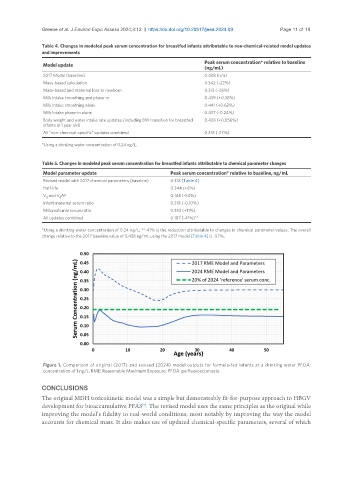
Figure 1. Comparison of original (2017) and revised (2024) model outputs for formula-fed infants at a drinking water PFOA
concentration of 1 ng/L. RME: Reasonable Maximum Exposure; PFOA: perfluorooctanoate.
CONCLUSIONS
The original MDH toxicokinetic model was a simple but demonstrably fit-for-purpose approach to HBGV
[9]
development for bioaccumulative PFAS . The revised model uses the same principles as the original while
improving the model’s fidelity to real-world conditions, most notably by improving the way the model
accounts for chemical mass. It also makes use of updated chemical-specific parameters, several of which