
Page 219 - Read Online
P. 219
Aminisani et al. Quality of life among rectal cancer patients
best and 100 the worst on symptom scales. This study received ethics approval from Tabriz
University of Medical Sciences; Ethics Committee
Statistical analysis and all patients completed an informed consent form
Descriptive analysis was used to present data, before the interview session.
mean and standard deviation (SD) was used for
quantitative variables, and numbers and percentages RESULTS
were provided for categorical data. Data checked for
normality and linearity where it was required. Total A total of 96 newly diagnosed patients with rectal
score of HRQOL and its dimensions score were cancer were included in this study with a mean age
as dependent variables in this study. Univariate 57.31 ± 14.15 years (min: 27, max: 83). The majority
and multivariate analysis performed to assess the of them were male (54%), 59% were over 55 years of
association between a range of factors and HRQOL. age and more than two-third resided in urban areas
Variables with a P value less than 0.1 were included (84%). About 45% of them had no education, and
in the multiple linear regression models to identify about 40% were out of work. Many of them (84%)
predictors of HRQOL. A P-value of less than 0.05 was reported inadequate physical activity, 30% smoked
predetermined to be mean statistical significance, and either a cigarette or waste pipe, 58% had at least one
SPSS version 21 was used for all data analyses. comorbidity, and the stage of the disease was I/II in
most of the cases (69%), 46% had received surgery
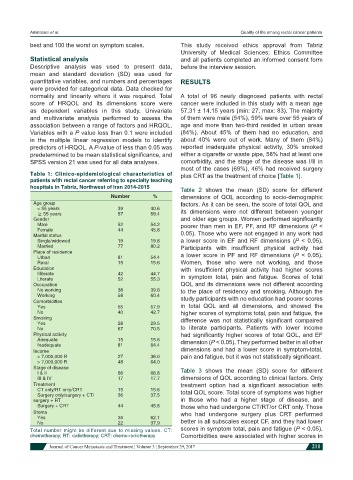
Table 1: Clinico-epidemiological characteristics of plus CRT as the treatment of choice [Table 1].
patients with rectal cancer referring to specialty teaching
hospitals in Tabriz, Northwest of Iran 2014-2015 Table 2 shows the mean (SD) score for different
Number % dimensions of QOL according to socio-demographic
Age group factors. As it can be seen, the score of total QOL and
< 55 years 39 40.6
≥ 55 years 57 59.4 its dimensions were not different between younger
Gender and older age groups. Women performed significantly
Male 52 54.2 poorer than men in EF, PF, and RF dimensions (P <
Female 44 45.8 0.05). Those who were not engaged in any work had
Marital status
Single/widowed 19 19.8 a lower score in EF and RF dimensions (P < 0.05).
Married 77 80.2 Participants with insufficient physical activity had
Place of residence
Urban 81 54.4 a lower score in PF and RF dimensions (P < 0.05).
Rural 15 15.6 Women, those who were not working, and those
Education with insufficient physical activity had higher scores
Illiterate 42 44.7 in symptom total, pain and fatigue. Scores of total
Literate 52 55.3
Occupation QOL and its dimensions were not different according
No working 38 39.6 to the place of residency and smoking. Although the
Working 58 60.4 study participants with no education had poorer scores
Comorbidities
Yes 55 57.9 in total QOL and all dimensions, and showed the
No 40 42.7 higher scores of symptoms total, pain and fatigue, the
Smoking difference was not statistically significant compaired
Yes 28 29.5
No 67 70.5 to literate participants. Patients with lower income
Physical activity had significantly higher scores of total QOL, and EF
Adequate 15 15.6 dimension (P < 0.05). They performed better in all other
Inadequate 81 84.4
Income dimensions and had a lower score in symptom-total,
< 7,000,000 R 27 36.0 pain and fatigue, but it was not statistically significant.
> 7,000,000 R 48 64.0
Stage of disease Table 3 shows the mean (SD) score for different
I & II 66 68.8
III & IV 17 17.7 dimensions of QOL according to clinical factors. Only
Treatment treatment option had a significant association with
CT only/RT only/CRT 15 15.6 total QOL score. Total score of symptoms was higher
Surgery only/surgery + CT/ 36 37.5
surgery + RT in those who had a higher stage of disease, and
Surgery + CRT 44 45.8 those who had undergone CT/RT/or CRT only. Those
Stoma who had undergone surgery plus CRT performed
Yes 36 62.1
No 22 37.9 better in all subscales except CF, and they had lower
Total number might be different due to missing values. CT: scores in symptom total, pain and fatigue (P < 0.05).
chemotherapy; RT: radiotherapy; CRT: chemo-radiotherapy Comorbidities were associated with higher scores in
Journal of Cancer Metastasis and Treatment ¦ Volume 3 ¦ September 29, 2017 211