
Page 221 - Read Online
P. 221
Aminisani et al. Quality of life among rectal cancer patients
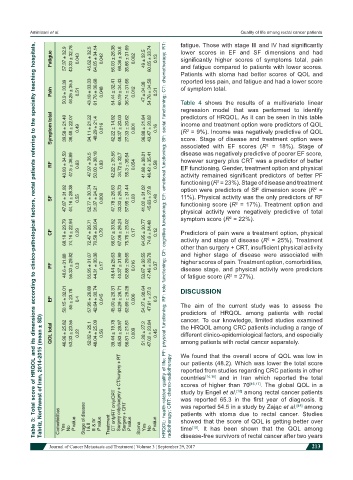
Table 3: Total score of HRQOL and its dimensions according to clinico-pathological factors, rectal patients referring to the specialty teaching hospitals,
fatigue. Those with stage III and IV had significantly
Fatigue 57.37 ± 32.9 43.33 ± 32.78 0.043 45.62 ± 32.5 64.05 ± 34.14 0.042 56.03 ± 26.38 66.36 ± 30.8 35.86 ± 31.69 0.002 49 ± 32.5 60.05 ± 33.74 0.13 lower scores in EF and SF dimensions and had
significantly higher scores of symptoms total, pain
and fatigue compared to patients with lower scores.
Patients with stoma had better scores of QOL and
reported less pain, and fatigue and had a lower score
Pain 50.9 ± 33.39 46.25 ± 35.5 0.51 43.18 ± 33.33 61.76 ± 36.68 0.048 54.44 ± 32.41 60.19 ± 34.43 36.74 ± 31.66 0.012 47 ± 34.38 54.76 ± 34.58 0.31 of symptom total.
Table 4 shows the results of a multivariate linear
regression model that was performed to identify
Symptom total 39.58 ± 21.49 36.48 ± 22.07 0.49 34.11 ± 21.22 48.29 ± 21.4 0.016 42.22 ± 14.92 48.37 ± 20.03 27.33 ± 20.62 0.001 36.88 ± 21.84 43.47 ± 20.82 0.16 income and treatment option were predictors of QOL
predictors of HRQOL. As it can be seen in this table
(R = 9%). Income was negatively predictive of QOL
2
score. Stage of disease and treatment option were
associated with EF scores (R = 18%). Stage of
2
disease was negatively predictive of poorer EF score,
43.93 ± 34.59 47.5 ± 36.89 0.63 47.97 ± 35.5 50.00 ± 38.18 0.83 42.22 ± 35.56 34.72 ± 32.7 55.3 ± 35.54 0.054 41.88 ± 38.01 46.42 ± 35.41 0.58 however surgery plus CRT was a predictor of better
RF EF functioning. Gender, treatment option and physical
activity remained significant predictors of better PF
functioning (R = 23%). Stage of disease and treatment
2
option were predictors of SF dimension score (R =
2
SF 47.87 ± 31.92 44.16 ± 28.38 0.55 52.77 ± 30.74 31.37 ± 24.21 0.009 47.78 ± 26.63 33.33 ± 26.73 57.95 ± 31.44 0.03 41.02 ± 31.02 45.63 ± 27.8 0.48 11%). Physical activity was the only predictors of RF
functioning score (R = 17%). Treatment option and
2
physical activity were negatively predictive of total
symptom score (R = 22%).
2
68.18 ± 29.79 74.16 ± 22.94 0.29 72.47 ± 26.71 70.58 ± 26.04 0.79 66.67 ± 33.92 67.06 ± 26.24 75.76 ± 25.02 0.17 64.95 ± 30.77 74.6 ± 24.48 0.12 Predictors of pain were a treatment option, physical
CF HRQOL: health-related quality of life; PF: physical functioning; RF: role functioning; CF: cognitive functioning; EF: emotional functioning; SF: social functioning; CT: chemotherapy; RT: activity and stage of disease (R = 25%). Treatment
2
other than surgery + CRT, insufficient physical activity
and higher stage of disease were associated with
PF 48.6 ± 31.88 55.33 ± 29.82 0.3 55.95 ± 31.07 44.31 ± 30.36 0.17 48.44 ± 25.63 40.37 ± 31.99 62.88 ± 29.55 0.016 53.67 ± 32.55 47.46 ± 29.78 0.37 higher scores of pain. Treatment option, comorbidities,
disease stage, and physical activity were predictors
of fatigue score (R = 27%).
2
50.15 ± 32.01 57.95 ± 26.89 42.64 ± 30.74 45.00 ± 26.31 43.29 ± 26.71 62.69 ± 29.28 54.27 ± 30.64 47.61 ± 27.0 DISCUSSION
EF 55 ± 23.78 0.4 0.045 0.006 0.3 The aim of the current study was to assess the
predictors of HRQOL among patients with rectal
Tabriz, Northwest of Iran, 2014-2015 (mean ± SD)
cancer. To our knowledge, limited studies examined
QOL total 46.96 ± 25.82 53.33 ± 23.55 0.22 52.02 ± 25.1 48.04 ± 25.09 0.56 39.44 ± 19.78 45.83 ± 28.97 56.81 ± 21.81 0.009 51.28 ± 27.2 47.02 ± 23.84 0.45 the HRQOL among CRC patients including a range of
different clinico-epidemiological factors, and especially
among patients with rectal cancer separately.
We found that the overall score of QOL was low in
our patients (48.2). Which was lower the total score
reported from studies regarding CRC patients in other
and in Iran which reported the total
countries
[14,15]
study by Engel et al.
among rectal cancer patients
[10]
was reported 65.3 in the first year of diagnosis. It
among
was reported 54.5 in a study by Zając et al.
[18]
Comorbidities Yes No P value Stage of disease I & II III & IV P value Treatment CT only/RT only/CRT Surgery only/surgery + CT/surgery + RT Surgery + CRT P value Stoma Yes No P value radiotherapy; CRT: chemo-radiotherapy scores of higher than 70 [16,17] . The global QOL in a
patients with stoma due to rectal cancer. Studies
showed that the score of QOL is getting better over
time
. It has been shown that the QOL among
[19]
disease-free survivors of rectal cancer after two years
Journal of Cancer Metastasis and Treatment ¦ Volume 3 ¦ September 29, 2017 213