
Page 189 - Read Online
P. 189
Glinsky Genetic signatures of lethal disease in early stage prostate cancer
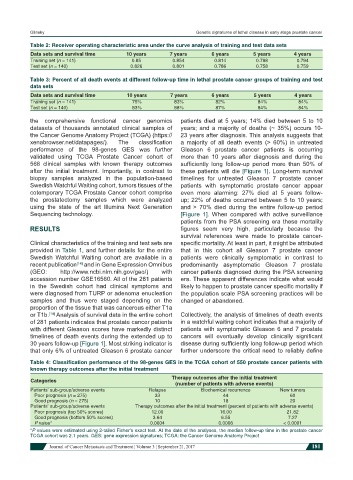
Table 2: Receiver operating characteristic area under the curve analysis of training and test data sets
Data sets and survival time 10 years 7 years 6 years 5 years 4 years
Training set (n = 141) 0.85 0.854 0.814 0.788 0.794
Test set (n = 140) 0.826 0.801 0.786 0.758 0.759
Table 3: Percent of all death events at different follow-up time in lethal prostate cancer groups of training and test
data sets
Data sets and survival time 10 years 7 years 6 years 5 years 4 years
Training set (n = 141) 75% 83% 82% 84% 84%
Test set (n = 140) 83% 88% 87% 84% 84%
the comprehensive functional cancer genomics patients died at 5 years; 14% died between 5 to 10
datasets of thousands annotated clinical samples of years; and a majority of deaths (~ 35%) occurs 10-
the Cancer Genome Anatomy Project (TCGA) (https:// 23 years after diagnosis. This analysis suggests that
xenabrowser.net/datapages/). The classification a majority of all death events (> 60%) in untreated
performance of the 98-genes GES was further Gleason 6 prostate cancer patients is occurring
validated using TCGA Prostate Cancer cohort of more than 10 years after diagnosis and during the
568 clinical samples with known therapy outcomes sufficiently long follow-up period more than 50% of
after the initial treatment. Importantly, in contrast to these patients will die [Figure 1]. Long-term survival
biopsy samples analyzed in the population-based timelines for untreated Gleason 7 prostate cancer
Swedish Watchful Waiting cohort, tumors tissues of the patients with symptomatic prostate cancer appear
cotemporary TCGA Prostate Cancer cohort comprise even more alarming: 27% died at 5 years follow-
the prostatectomy samples which were analyzed up; 22% of deaths occurred between 5 to 10 years;
using the state of the art Illumina Next Generation and > 70% died during the entire follow-up period
Sequencing technology. [Figure 1]. When compared with active surveillance
patients from the PSA screening era these mortality
RESULTS figures seem very high, particularly because the
survival references were made to prostate cancer-
Clinical characteristics of the training and test sets are specific mortality. At least in part, it might be attributed
provided in Table 1, and further details for the entire that in this cohort all Gleason 7 prostate cancer
Swedish Watchful Waiting cohort are available in a patients were clinically symptomatic in contrast to
recent publication and in Gene Expression Omnibus predominantly asymptomatic Gleason 7 prostate
[14]
(GEO: http://www.ncbi.nlm.nih.gov/geo/) with cancer patients diagnosed during the PSA screening
accession number GSE16560. All of the 281 patients era. These apparent differences indicate what would
in the Swedish cohort had clinical symptoms and likely to happen to prostate cancer specific mortality if
were diagnosed from TURP or adenoma enucleation the population scale PSA screening practices will be
samples and thus were staged depending on the changed or abandoned.
proportion of the tissue that was cancerous either T1a
or T1b. Analysis of survival data in the entire cohort Collectively, the analysis of timelines of death events
[14]
of 281 patients indicates that prostate cancer patients in a watchful waiting cohort indicates that a majority of
with different Gleason scores have markedly distinct patients with symptomatic Gleason 6 and 7 prostate
timelines of death events during the extended up to cancers will eventually develop clinically significant
30 years follow-up [Figure 1]. Most striking indicator is disease during sufficiently long follow-up period which
that only 6% of untreated Gleason 6 prostate cancer further underscore the critical need to reliably define
Table 4: Classification performance of the 98-genes GES in the TCGA cohort of 550 prostate cancer patients with
known therapy outcomes after the initial treatment
Therapy outcomes after the initial treatment
Categories
(number of patients with adverse events)
Patients’ sub-group/adverse events Relapse Biochemical recurrence New tumors
Poor prognosis (n = 275) 33 44 60
Good prognosis (n = 275) 10 18 20
Patients’ sub-group/adverse events Therapy outcomes after the initial treatment (percent of patients with adverse events)
Poor prognosis (top 50% scores) 12.00 16.00 21.82
Good prognosis (bottom 50% scores) 3.64 6.55 7.27
P value* 0.0004 0.0006 < 0.0001
*P values were estimated using 2-tailed Fisher’s exact test. At the date of the analyses, the median follow-up time in the prostate cancer
TCGA cohort was 2.1 years. GES: gene expression signatures; TCGA: the Cancer Genome Anatomy Project
Journal of Cancer Metastasis and Treatment ¦ Volume 3 ¦ September 21, 2017 181