
Page 194 - Read Online
P. 194
Glinsky Genetic signatures of lethal disease in early stage prostate cancer
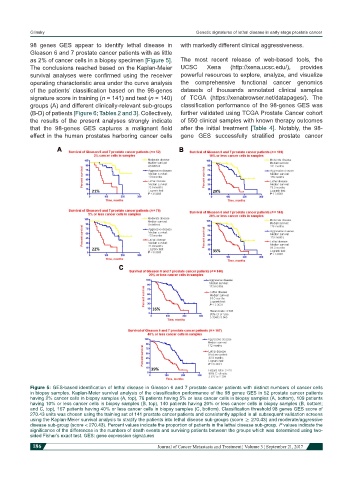
98 genes GES appear to identify lethal disease in with markedly different clinical aggressiveness.
Gleason 6 and 7 prostate cancer patients with as little
as 2% of cancer cells in a biopsy specimen [Figure 5]. The most recent release of web-based tools, the
The conclusions reached based on the Kaplan-Meier UCSC Xena (http://xena.ucsc.edu/), provides
survival analyses were confirmed using the receiver powerful resources to explore, analyze, and visualize
operating characteristic area under the curve analysis the comprehensive functional cancer genomics
of the patients’ classification based on the 98-genes datasets of thousands annotated clinical samples
signature score in training (n = 141) and test (n = 140) of TCGA (https://xenabrowser.net/datapages/). The
groups (A) and different clinically-relevant sub-groups classification performance of the 98-genes GES was
(B-D) of patients [Figure 6; Tables 2 and 3]. Collectively, further validated using TCGA Prostate Cancer cohort
the results of the present analyses strongly indicate of 550 clinical samples with known therapy outcomes
that the 98-genes GES captures a malignant field after the initial treatment [Table 4]. Notably, the 98-
effect in the human prostates harboring cancer cells gene GES successfully stratified prostate cancer
Figure 5: GES-based identification of lethal disease in Gleason 6 and 7 prostate cancer patients with distinct numbers of cancer cells
in biopsy samples. Kaplan-Meier survival analysis of the classification performance of the 98 genes GES in 52 prostate cancer patients
having 2% cancer cells in biopsy samples (A, top), 76 patients having 5% or less cancer cells in biopsy samples (A, bottom), 109 patients
having 10% or less cancer cells in biopsy samples (B, top), 140 patients having 20% or less cancer cells in biopsy samples (B, bottom;
and C, top), 167 patients having 40% or less cancer cells in biopsy samples (C, bottom). Classification threshold 98 genes GES score of
270.43 units was chosen using the training set of 141 prostate cancer patients and consistently applied in all subsequent validation screens
using the Kaplan-Meier survival analysis to stratify the patients into lethal disease sub-groups (score ≥ 270.43) and moderate/aggressive
disease sub-group (score < 270.43). Percent values indicate the proportion of patients in the lethal disease sub-group. P values indicate the
significance of the differences in the numbers of death events and surviving patients between the groups which was determined using two-
sided Fisher’s exact test. GES: gene expression signatures
186 Journal of Cancer Metastasis and Treatment ¦ Volume 3 ¦ September 21, 2017