
Page 193 - Read Online
P. 193
Glinsky Genetic signatures of lethal disease in early stage prostate cancer
cancer patients of 65 years or younger [Figure 3]: in percent of cancer cells in a sample varied dramatically
Gleason 6 and 7 prostate cancer patients of age 65 or from 2% to 90%. We therefore set out to determine
younger, GES identifies 86% of all death events during whether the number of cancer cells in biopsy samples
the follow-up. In Gleason 6 and 7 prostate cancer would have an impact on classification performance
patients of age 70 or younger, GES identifies 90% of of the 98 genes GES of lethal prostate cancer. We
all death events 6 years after diagnosis [Figure 3]. applied the 98 genes GES classifier to prostate cancer
patients which were segregated into distinct sub-
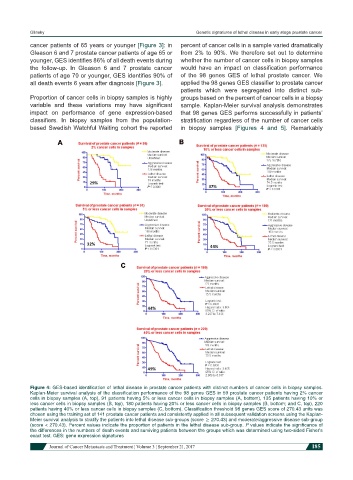
Proportion of cancer cells in biopsy samples is highly groups based on the percent of cancer cells in a biopsy
variable and these variations may have significant sample. Kaplan-Meier survival analysis demonstrates
impact on performance of gene expression-based that 98 genes GES performs successfully in patients’
classifiers. In biopsy samples from the population- stratification regardless of the number of cancer cells
based Swedish Watchful Waiting cohort the reported in biopsy samples [Figures 4 and 5]. Remarkably
Figure 4: GES-based identification of lethal disease in prostate cancer patients with distinct numbers of cancer cells in biopsy samples.
Kaplan-Meier survival analysis of the classification performance of the 98 genes GES in 59 prostate cancer patients having 2% cancer
cells in biopsy samples (A, top), 91 patients having 5% or less cancer cells in biopsy samples (A, bottom), 135 patients having 10% or
less cancer cells in biopsy samples (B, top), 180 patients having 20% or less cancer cells in biopsy samples (B, bottom; and C, top), 220
patients having 40% or less cancer cells in biopsy samples (C, bottom). Classification threshold 98 genes GES score of 270.43 units was
chosen using the training set of 141 prostate cancer patients and consistently applied in all subsequent validation screens using the Kaplan-
Meier survival analysis to stratify the patients into lethal disease sub-groups (score ≥ 270.43) and moderate/aggressive disease sub-group
(score < 270.43). Percent values indicate the proportion of patients in the lethal disease sub-group. P values indicate the significance of
the differences in the numbers of death events and surviving patients between the groups which was determined using two-sided Fisher’s
exact test. GES: gene expression signatures
Journal of Cancer Metastasis and Treatment ¦ Volume 3 ¦ September 21, 2017 185