
Page 188 - Read Online
P. 188
Glinsky Genetic signatures of lethal disease in early stage prostate cancer
carried out to identify statistically significant candidate of men with lethal and indolent prostate cancer and
GES associated with patients’ survival status. Cut-off statistically undistinguishable clinical and pathological
threshold of P-values was set based on the P-value variables, e.g. age and time of diagnosis, follow
of the best-performing clinico-pathological parameter up time, Gleason scores, percent of cancer cells in
(Gleason score) in univariate Cox regression analysis specimens [Table 1]. The training set of 141 samples
(P = 0.0113). Genes from statistically significant GES was utilized to identify and select the best classifier,
were split, combined, and permutated using random whose performance was evaluated on the test set
iteration process to find novel statistically significant of 140 samples without any further adjustments to
combinations based on univariate Cox regression the threshold selection and classification protocols
analysis. GES scores were derived directly from using Kaplan-Meyer survival analysis essentially
measurements of expression values of each gene by as previously described. [17-20] Best-performing GES
calculating a single numerical value for each patient. classifiers were further evaluated in various clinically-
GES scores represent the difference between sums of relevant patients’ sub-groups, including only Gleason
expression values of genes with common co-regulation 6 patients (n = 83), only Gleason 7 patients (n = 117),
profiles which is defined by up-regulation and/or Gleason 6 and 7 patients (n = 200), with further sub-
positive correlation values versus down-regulation division of patients in additional validation screens
and/or negative correlation values. GES with P values based on age at diagnosis (age 65 and younger;
< 0.01 were selected for further evaluation using age 70 and younger) and percent of cancer cells in
multivariate Cox regression analysis of classification the samples (2%; 5% or less; 10% or less; 20% or
models which include GES and clinico-pathological co- less; 40% or less; and 50% or more). In all these
variants (age and Gleason score). Cut-off threshold of secondary validation screens no further adjustments
P-values for candidate GES selection was set based on to the threshold selection and classification protocols
the P-value of the best-performing clinico-pathological were made. Ninety-eight genes classifier that remains
model (age and Gleason score) in multivariate Cox statistically significant in all these validation screens is
regression analysis (P = 0.0052). Candidate GES reported in this paper.
that outperformed clinico-pathological models in
multivariate Cox regression analysis were selected for Statistical significance of the Pearson correlation
further consideration using a split-sample validation coefficients for individual test samples, clinical
procedure for classification threshold selection variables, and the appropriate reference standard
and GES classification performance evaluation as were determined using GraphPad Prism version
previously described. [17-20] 4.00 software. We calculated the significance of
the differences in the numbers of death events and
Gene expression-based classification models were surviving patients between the groups using two-sided
designed and evaluated through a split-sample Fisher’s exact test and the significance of the overlap
validation procedure which enables the unbiased between the lists of differentially-regulated genes using
estimation of the performance of a classifier since the the hypergeometric distribution test. [22]
evaluation is performed on an independent data set.
[21]
Specifically, the entire data set of 281 patients was Validation analyses of GES were performed using the
split into training and test sets (141 and 140 patients, most recent release of web-based tools, the UCSC
respectively), with approximately equal proportion Xena (http://xena.ucsc.edu/) to explore and visualize
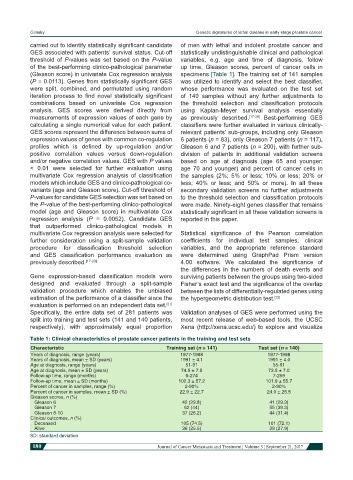
Table 1: Clinical characteristics of prostate cancer patients in the training and test sets
Characteristic Training set (n = 141) Test set (n = 140)
Years of diagnosis, range (years) 1977-1998 1977-1998
Years of diagnosis, mean ± SD (years) 1991 ± 4.1 1991 ± 4.0
Age at diagnosis, range (years) 51-91 55-91
Age at diagnosis, mean ± SD (years) 74.5 ± 7.5 73.5 ± 7.0
Follow-up time, range (months) 6-274 7-259
Follow-up time, mean ± SD (months) 102.3 ± 57.2 101.9 ± 55.7
Percent of cancer in samples, range (%) 2-90% 2-90%
Percent of cancer in samples, mean ± SD (%) 22.9 ± 22.7 24.0 ± 25.5
Gleason scores, n (%)
Gleason 6 42 (29.8) 41 (29.3)
Gleason 7 62 (44) 55 (39.3)
Gleason 8-10 37 (26.2) 44 (31.4)
Clinical outcomes, n (%)
Deceased 105 (74.5) 101 (72.1)
Alive 36 (25.5) 39 (27.9)
SD: standard deviation
180 Journal of Cancer Metastasis and Treatment ¦ Volume 3 ¦ September 21, 2017