
Page 271 - Read Online
P. 271
Growth curve for control vs. treated CAF prepared from extracted RNA by using cDNA Reverse
Cells were plated at a density of 5 × 10 per well in a 6 transcriptase kit. Gene expression studies were performed
4
well plate and fed with the DMEM medium. The cells using PCR. The PCR mix consisted of ammonium
were collected from each well at different time intervals, sulphate buffer including 1.5 mm MgCl 200 µm of each
2,
i.e., 24 h, 48 h, 72 h, and 96 h. For each time point the of the dNTPs, 200 ng/µL each primer, 1U Taq Polymerase,
cells were washed with 1 × PBS and trypsinized. The and 5µL cDNA. Pluripotency markers (Oct-4, Nanog,
trypsinized cells were mixed with equal amount of SOX2), differentiating markers (Keratin 18, Vimentin,
Erythrocin B. The cell count was taken by using Neubauer E-Cadherin, VEGF), chemokine and cytokine (CXCR-
hemocytometer. The cell growth rate was carried out for 4, CXCR-7, CCR5 and Sdf-1α), and metastatic markers
control and 100 µg treated Ch-Np. The experiment was (MMP1, MMP9) were used. Primers and annealing
repeated three times and average growth and Standard temperatures used for these genes are mentioned in Table
Deviation were calculated for each time point. 1. Initial denaturation was carried out at 95℃ followed
by denaturation at 94℃; annealing (specified in Table 1),
Cellular morphology of CAF cells extension at 72℃ and final extension at 72℃ for 7 min.
CAF cell morphology was observed before and after Forty cycles were run for each PCR followed by gel loading
treatment with Ch-Np. Sixty-five millimeter petri dishes and observation under UV-illuminator and photographed.
were seeded with 5 × 10 cells per plate. Two plates were
4
taken, one as untreated control whereas another dish was Scratch assay for evaluation of CAF migration
4
treated with 100 µg/mL Ch-Np. Cell morphology was Two 65 mm plates were initially seeded with 5 × 10 cells
observed under phase contrast microscopy for after 24 h, per plate. The cells were then allowed to reach confluency.
48 h, and 72 h of treatment and compared to control cells. After reaching confluency, both dishes were scratched
with the help of a sterile scalpel. Care was taken to scratch
Molecular marker analysis equal areas in both culture plates. This caused a loss of
Two 65 mm petri dishes were seeded with 20 × 10 cells cells on the scratched area. The scratched control plate
4
per plate. The cells were then washed with PBS and fed was kept as it is whereas other the scratched plate was
with new DMEM daily. After 2 days one plate was treated treated with 100 µg/mL Ch-Np and incubated at 37 C at
o
with 100 ug/mL Ch-Np. After 24 h of treatment the cells 5% CO The scratched area was observed under the phase
2.
were washed with PBS and RNA extraction from cells was contrast microscope after 24 h, 48 h, and 72 h of treatment
carried out using TRIZOL method (Invitrigen). cDNA was and photographed for cell migration. This experiment was
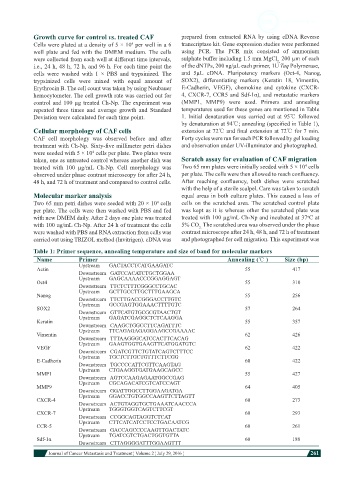
Table 1: Primer sequence, annealing temperature and size of band for molecular markers
Name Primer Annealing (℃ ) Size (bp)
Upstream GACTACCTCATGAAGATC
Actin 55 417
Downstream GATCCACATCTGCTGGAA
Oct4 Upstream GAGCAAAACCCGGAGGAGT 55 310
Downstream TTCTCTTTCGGGCCTGCAC
Nanog Upstream GCTTGCCTTGCTTTGAAGCA 55 256
Downstream TTCTTGACCGGGACCTTGTC
SOX2 Upstream GCCGAGTGGAAACTTTTGTC 57 264
Downstream GTTCATGTGCGCGTAACTGT
Keratin Upstream GAGATCGAGGCTCTCAAGGA 55 357
Downstream CAAGCTGGCCTTCAGATTTC
Vimentin Upstream TTCAGAGAGAGGAAGCCGAAAAC 62 426
Downstream TTTAAGGGCATCCACTTCACAG
VEGF Upstream GAAGTGGTGAAGTTCATGGATGTC 62 422
Downstream CGATCGTTCTGTATCAGTCTTTCC
E-Cadherin Upstream TGCTCTTGCTGTTTCTTCGG 60 422
Downstream TGCCCCATTCGTTCAAGTAG
MMP1 Upstream CTGAAGGTGATGAAGCAGCC 55 427
Downstream AGTCCAAGAGAATGGCCGAG
MMP9 Upstream CGCAGACATCGTCATCCAGT 64 405
Downstream GGATTGGCCTTGGAAGATGA
CXCR-4 Upstream GGACCTGTGGCCAAGTTCTTAGTT 60 273
Downstream ACTGTAGGTGCTGAAATCAACCCA
CXCR-7 Upstream TGGGTGGTCAGTCTTCGT 60 293
Downstream CCGGCAGTAGGTCTCAT
CCR-5 Upstream CTTCATCATCCTCCTGACAATCG 60 261
Downstream GACCAGCCCCAAGTTGACTATC
Sdf-1α Upstream TGATCGTCTGACTGGTGTTA 60 188
Downstream CTTAGGGGATTTGGAAGTTT
Journal of Cancer Metastasis and Treatment ¦ Volume 2 ¦ July 29, 2016 ¦ 261