
Page 273 - Read Online
P. 273
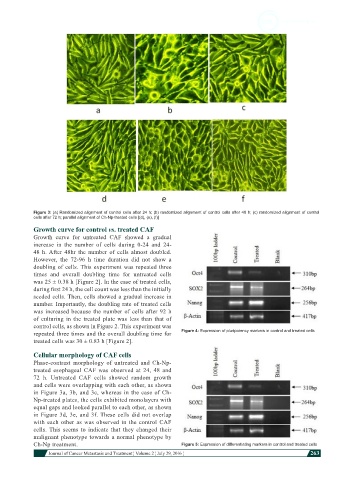
Figure 3: (a) Randomized alignment of control cells after 24 h; (b) randomized alignment of control cells after 48 h; (c) randomized alignment of control
            cells after 72 h; parallel alignment of Ch-Np-treated cells [(d), (e), (f)]
            Growth curve for control vs. treated CAF
            Growth  curve  for  untreated  CAF  showed  a  gradual
            increase  in  the number  of cells during 0-24 and 24-
            48  h. After  48hr  the  number  of  cells  almost  doubled.
            However, the 72-96 h time duration did not show a
            doubling of cells. This experiment was repeated three
            times and overall doubling time for untreated cells
            was 25 ± 0.38 h [Figure 2]. In the case of treated cells,
            during first 24 h, the cell count was less than the initially
            seeded cells. Then, cells showed a gradual increase in
            number. Importantly, the doubling rate of treated cells
            was increased because the number of cells after 92 h
            of culturing in the treated plate was less than that of
            control cells, as shown in Figure 2. This experiment was
            repeated three times and the overall doubling time for   Figure 4: Expression of pluripotency markers in control and treated cells
            treated cells was 30 ± 0.83 h [Figure 2].

            Cellular morphology of CAF cells
            Phase-contrast  morphology  of  untreated  and  Ch-Np-
            treated  esophageal  CAF  was  observed  at  24,  48  and
            72  h.  Untreated  CAF  cells  showed  random  growth
            and cells were overlapping with each other, as shown
            in Figure 3a, 3b, and 3c, whereas in the case of Ch-
            Np-treated plates, the cells exhibited monolayers with
            equal gaps and looked parallel to each other, as shown
            in Figure 3d, 3e, and 3f. These cells did not overlap
            with  each  other  as  was  observed  in  the  control  CAF
            cells. This seems to indicate that they changed their
            malignant phenotype towards a normal phenotype by
            Ch-Np treatment.                                  Figure 5: Expression of differentiating markers in control and treated cells
                         Journal of Cancer Metastasis and Treatment ¦ Volume 2 ¦ July 29, 2016 ¦          263