
Page 14 - Read Online
P. 14
Cheng et al. J Cancer Metastasis Treat 2021;7:17 https://dx.doi.org/10.20517/2394-4722.2021.27 Page 9 of 18
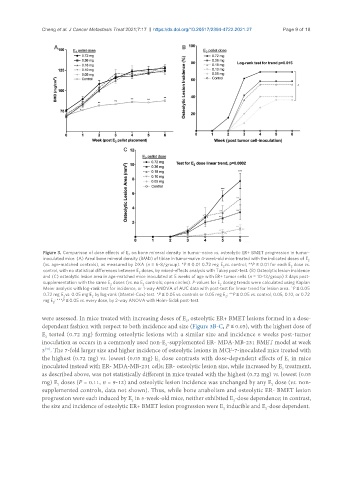
Figure 3. Comparison of dose effects of E on bone mineral density in tumor-naive vs. osteolytic ER+ BMET progression in tumor-
2
inoculated mice. (A) Areal bone mineral density (BMD) of tibiae in tumor-naive 4-week-old mice treated with the indicated doses of E 2
(vs. age-matched controls), as measured by DXA (n = 6-8/group). *P ≤ 0.01 0.72 mg E vs. control; **P ≤ 0.01 for each E dose vs.
2
2
control, with no statistical differences between E doses, by mixed-effects analysis with Tukey post-test. (B) Osteolytic lesion incidence
2
and (C) osteolytic lesion area in age-matched mice inoculated at 5 weeks of age with ER+ tumor cells (n = 10-13/group) 3 days post-
supplementation with the same E doses (vs. no E controls; open circles). P-values for E dosing trends were calculated using Kaplan
2
2
2
Meier analysis with log-rank test for incidence, or 1-way ANOVA of AUC data with post-test for linear trend for lesion area. ^P ≤ 0.05
0.72 mg E vs. 0.05 mg E by log-rank (Mantel-Cox) test. *P ≤ 0.05 vs. controls or 0.05 mg E ; **P ≤ 0.05 vs. control, 0.05, 0.10, or 0.72
2
2
2
mg E ; ***P ≤ 0.05 vs. every dose, by 2-way ANOVA with Holm-Sidak post-test.
2
were assessed. In mice treated with increasing doses of E , osteolytic ER+ BMET lesions formed in a dose-
2
dependent fashion with respect to both incidence and size (Figure 3B-C, P ≤ 0.05), with the highest dose of
E tested (0.72 mg) forming osteolytic lesions with a similar size and incidence 6 weeks post-tumor
2
inoculation as occurs in a commonly used non-E -supplemented ER- MDA-MB-231 BMET model at week
2
[41]
3 . The 7-fold larger size and higher incidence of osteolytic lesions in MCF-7-inoculated mice treated with
the highest (0.72 mg) vs. lowest (0.05 mg) E dose contrasts with dose-dependent effects of E in mice
2
2
inoculated instead with ER- MDA-MB-231 cells; ER- osteolytic lesion size, while increased by E treatment,
2
as described above, was not statistically different in mice treated with the highest (0.72 mg) vs. lowest (0.05
mg) E doses (P = 0.11, n = 9-12) and osteolytic lesion incidence was unchanged by any E dose (vs. non-
2
2
supplemented controls, data not shown). Thus, while bone anabolism and osteolytic ER- BMET lesion
progression were each induced by E in 5-week-old mice, neither exhibited E -dose dependence; in contrast,
2
2
the size and incidence of osteolytic ER+ BMET lesion progression were E inducible and E -dose dependent.
2
2